Test For Paddings
Test Stats Grid
Test Stats Grid
Test Stats Grid
Test Grid

Title 1
Description 1
Title 3
Description 1
Title 4
Description 1
The U.S. wood products industry makes products essential to everyday life from a renewable resource.
Click on a state to display employment statistics in the text field to the right.
- Makes products essential to everyday life from a renewable resource that absorbs and sequesters carbon
- Employs almost 465,000 people in wood products manufacturing and supports additional jobs in forestry and other industries
- Pays over $2.2 billion in state and local taxes annually
 Download / Print PDF
 REPRESENTATIVE
Ed Case
EMPLOYMENT
Direct 121
Indirect 107
Induced 70
Total Employment 298
COMPENSATION
Direct $4,710,990
Indirect $8,812,368
Induced $4,446,533
Total $17,969,891
INDUSTRY OUTPUT
Value of Production – Direct $35,469,319
Value Added – Direct $4,354,078
EMPLOYMENT
Direct 512
Indirect 444
Induced 296
Total Employment 1,253
COMPENSATION
Direct $18,528,503
Indirect $33,458,739
Induced $18,672,282
Total $70,659,524
INDUSTRY OUTPUT
Value of Production – Direct $173,997,148
Value Added – Direct $16,461,160
REPRESENTATIVE
Jill Tokuda
EMPLOYMENT
Direct 391
Indirect 338
Induced 226
Total Employment 955
COMPENSATION
Direct $13,817,513
Indirect $24,646,371
Induced $14,225,749
Total $52,689,633
INDUSTRY OUTPUT
Value of Production – Direct $138,527,829
Value Added – Direct $12,107,082
REPRESENTATIVE
Nick Begich III
EMPLOYMENT
Direct 474
Indirect 492
Induced 287
Total Employment 1,253
COMPENSATION
Direct $17,775,012
Indirect $36,479,669
Induced $18,599,232
Total $72,853,913
INDUSTRY OUTPUT
Value of Production – Direct $182,498,330
Value Added – Direct $41,622,629
EMPLOYMENT
Direct 474
Indirect 492
Induced 287
Total Employment 1,253
COMPENSATION
Direct $17,775,012
Indirect $36,479,669
Induced $18,599,232
Total $72,853,913
INDUSTRY OUTPUT
Value of Production – Direct $182,498,330
Value Added – Direct $41,622,629
REPRESENTATIVE
Donald Norcross
EMPLOYMENT
Direct 647
Indirect 754
Induced 686
Total Employment 2,088
COMPENSATION
Direct $51,608,172
Indirect $59,181,014
Induced $44,770,462
Total $155,559,648
INDUSTRY OUTPUT
Value of Production – Direct $224,874,078
Value Added – Direct $46,303,630
EMPLOYMENT
Direct 3,458
Indirect 2,853
Induced 2,502
Total Employment 8,813
COMPENSATION
Direct $284,408,826
Indirect $246,309,766
Induced $170,450,672
Total $701,169,264
INDUSTRY OUTPUT
Value of Production – Direct $1,149,495,703
Value Added – Direct $257,573,499
REPRESENTATIVE
Jeff Van Drew
EMPLOYMENT
Direct 526
Indirect 459
Induced 412
Total Employment 1,397
COMPENSATION
Direct $39,954,059
Indirect $32,179,017
Induced $25,988,940
Total $98,122,017
INDUSTRY OUTPUT
Value of Production – Direct $140,683,914
Value Added – Direct $37,761,272
REPRESENTATIVE
Herbert Conaway
EMPLOYMENT
Direct 77
Indirect 80
Induced 56
Total Employment 213
COMPENSATION
Direct $5,079,057
Indirect $6,643,516
Induced $3,857,190
Total $15,579,763
INDUSTRY OUTPUT
Value of Production – Direct $24,870,067
Value Added – Direct $4,458,026
REPRESENTATIVE
Chris Smith
EMPLOYMENT
Direct 133
Indirect 94
Induced 89
Total Employment 316
COMPENSATION
Direct $11,608,155
Indirect $7,100,658
Induced $5,541,199
Total $24,250,013
INDUSTRY OUTPUT
Value of Production – Direct $38,065,520
Value Added – Direct $11,015,794
REPRESENTATIVE
Josh Gottheimer
EMPLOYMENT
Direct 54
Indirect 35
Induced 36
Total Employment 125
COMPENSATION
Direct $4,908,361
Indirect $3,363,589
Induced $2,543,574
Total $10,815,525
INDUSTRY OUTPUT
Value of Production – Direct $17,837,275
Value Added – Direct $4,578,186
REPRESENTATIVE
Frank Pallone
EMPLOYMENT
Direct 115
Indirect 96
Induced 70
Total Employment 281
COMPENSATION
Direct $9,968,509
Indirect $8,818,735
Induced $4,894,348
Total $23,681,592
INDUSTRY OUTPUT
Value of Production – Direct $39,518,820
Value Added – Direct $8,911,114
REPRESENTATIVE
Tom Kean Jr.
EMPLOYMENT
Direct 338
Indirect 192
Induced 212
Total Employment 742
COMPENSATION
Direct $36,174,720
Indirect $19,056,095
Induced $15,046,018
Total $70,276,832
INDUSTRY OUTPUT
Value of Production – Direct $112,950,026
Value Added – Direct $34,074,606
REPRESENTATIVE
Rob Menendez
EMPLOYMENT
Direct 641
Indirect 520
Induced 393
Total Employment 1,554
COMPENSATION
Direct $47,333,901
Indirect $50,771,192
Induced $28,439,370
Total $126,544,462
INDUSTRY OUTPUT
Value of Production – Direct $229,588,249
Value Added – Direct $41,362,069
REPRESENTATIVE
Nellie Pou
EMPLOYMENT
Direct 349
Indirect 256
Induced 202
Total Employment 807
COMPENSATION
Direct $27,689,752
Indirect $22,858,470
Induced $14,404,878
Total $64,953,100
INDUSTRY OUTPUT
Value of Production – Direct $109,241,015
Value Added – Direct $25,075,481
REPRESENTATIVE
LaMonica McIver
EMPLOYMENT
Direct 154
Indirect 75
Induced 71
Total Employment 299
COMPENSATION
Direct $11,316,521
Indirect $7,027,619
Induced $5,119,355
Total $23,463,495
INDUSTRY OUTPUT
Value of Production – Direct $46,882,389
Value Added – Direct $10,268,706
REPRESENTATIVE
Mikie Sherrill
EMPLOYMENT
Direct 88
Indirect 55
Induced 55
Total Employment 198
COMPENSATION
Direct $10,053,171
Indirect $5,888,694
Induced $4,079,414
Total $20,021,279
INDUSTRY OUTPUT
Value of Production – Direct $28,349,493
Value Added – Direct $9,731,429
REPRESENTATIVE
Bonnie Watson Coleman
EMPLOYMENT
Direct 336
Indirect 237
Induced 222
Total Employment 795
COMPENSATION
Direct $28,714,449
Indirect $23,421,167
Induced $15,765,922
Total $67,901,538
INDUSTRY OUTPUT
Value of Production – Direct $136,634,858
Value Added – Direct $24,033,186
REPRESENTATIVE
Sarah McBride
EMPLOYMENT
Direct 359
Indirect 274
Induced 239
Total Employment 872
COMPENSATION
Direct $25,970,200
Indirect $19,190,171
Induced $14,503,769
Total $59,664,140
INDUSTRY OUTPUT
Value of Production – Direct $117,343,811
Value Added – Direct $30,340,989
EMPLOYMENT
Direct 359
Indirect 274
Induced 239
Total Employment 872
COMPENSATION
Direct $25,970,200
Indirect $19,190,171
Induced $14,503,769
Total $59,664,140
INDUSTRY OUTPUT
Value of Production – Direct $117,343,811
Value Added – Direct $30,340,989
REPRESENTATIVE
Andy Harris
EMPLOYMENT
Direct 436
Indirect 655
Induced 335
Total Employment 1,427
COMPENSATION
Direct $17,581,023
Indirect $45,796,554
Induced $19,701,467
Total $83,079,044
INDUSTRY OUTPUT
Value of Production – Direct $192,244,786
Value Added – Direct $46,996,634
EMPLOYMENT
Direct 3,559
Indirect 3,175
Induced 2,095
Total Employment 8,828
COMPENSATION
Direct $167,856,913
Indirect $236,191,401
Induced $127,923,277
Total $531,971,592
INDUSTRY OUTPUT
Value of Production – Direct $1,416,520,167
Value Added – Direct $450,552,966
REPRESENTATIVE
Johnny Olszewski
EMPLOYMENT
Direct 521
Indirect 384
Induced 332
Total Employment 1,237
COMPENSATION
Direct $41,504,280
Indirect $27,692,324
Induced $20,189,879
Total $89,386,483
INDUSTRY OUTPUT
Value of Production – Direct $219,567,898
Value Added – Direct $84,629,783
REPRESENTATIVE
Sarah Elfreth
EMPLOYMENT
Direct 180
Indirect 170
Induced 57
Total Employment 407
COMPENSATION
Direct $136,999
Indirect $14,200,870
Induced $3,483,751
Total $17,821,620
INDUSTRY OUTPUT
Value of Production – Direct $59,475,668
Value Added – Direct $11,433,194
REPRESENTATIVE
Glenn Ivey
EMPLOYMENT
Direct 324
Indirect 238
Induced 224
Total Employment 787
COMPENSATION
Direct $28,172,994
Indirect $15,971,276
Induced $13,458,396
Total $57,602,666
INDUSTRY OUTPUT
Value of Production – Direct $136,543,987
Value Added – Direct $58,447,634
REPRESENTATIVE
Steny Hoyer
EMPLOYMENT
Direct 192
Indirect 131
Induced 90
Total Employment 413
COMPENSATION
Direct $6,371,986
Indirect $9,053,263
Induced $5,563,347
Total $20,988,595
INDUSTRY OUTPUT
Value of Production – Direct $75,969,049
Value Added – Direct $18,750,426
REPRESENTATIVE
April McClain Delaney
EMPLOYMENT
Direct 1,011
Indirect 905
Induced 651
Total Employment 2,568
COMPENSATION
Direct $48,908,168
Indirect $67,631,695
Induced $41,316,977
Total $157,856,839
INDUSTRY OUTPUT
Value of Production – Direct $403,176,618
Value Added – Direct $126,444,786
REPRESENTATIVE
Kweisi Mfume
EMPLOYMENT
Direct 583
Indirect 437
Induced 257
Total Employment 1,276
COMPENSATION
Direct $24,791,086
Indirect $34,347,999
Induced $15,271,410
Total $74,410,495
INDUSTRY OUTPUT
Value of Production – Direct $185,427,422
Value Added – Direct $55,774,235
REPRESENTATIVE
Jamie Raskin
EMPLOYMENT
Direct 311
Indirect 256
Induced 148
Total Employment 714
COMPENSATION
Direct $390,377
Indirect $21,497,421
Induced $8,938,051
Total $30,825,849
INDUSTRY OUTPUT
Value of Production – Direct $144,114,739
Value Added – Direct $48,076,274
REPRESENTATIVE
Carol Miller
EMPLOYMENT
Direct 2,376
Indirect 2,565
Induced 1,853
Total Employment 6,793
COMPENSATION
Direct $135,948,114
Indirect $183,835,158
Induced $107,040,232
Total $426,823,504
INDUSTRY OUTPUT
Value of Production – Direct $1,218,806,226
Value Added – Direct $355,408,832
EMPLOYMENT
Direct 4,761
Indirect 4,696
Induced 3,408
Total Employment 12,865
COMPENSATION
Direct $267,528,154
Indirect $324,418,873
Induced $195,378,244
Total $787,325,271
INDUSTRY OUTPUT
Value of Production – Direct $2,197,503,930
Value Added – Direct $631,636,985
REPRESENTATIVE
Riley Moore
EMPLOYMENT
Direct 2,385
Indirect 2,132
Induced 1,555
Total Employment 6,072
COMPENSATION
Direct $131,580,040
Indirect $140,583,715
Induced $88,338,012
Total $360,501,768
INDUSTRY OUTPUT
Value of Production – Direct $978,697,704
Value Added – Direct $276,228,153
REPRESENTATIVE
Vacant
EMPLOYMENT
Direct 310
Indirect 497
Induced 471
Total Employment 1,278
COMPENSATION
Direct $18,704,243
Indirect $33,541,192
Induced $27,530,517
Total $79,775,952
INDUSTRY OUTPUT
Value of Production – Direct $123,945,298
Value Added – Direct $30,870,102
EMPLOYMENT
Direct 16,957
Indirect 17,439
Induced 15,210
Total Employment 49,606
COMPENSATION
Direct $1,354,153,378
Indirect $1,269,692,552
Induced $872,072,691
Total $3,495,918,621
INDUSTRY OUTPUT
Value of Production – Direct $7,190,713,349
Value Added – Direct $2,329,791,482
REPRESENTATIVE
Neal Dunn
EMPLOYMENT
Direct 1,475
Indirect 2,542
Induced 2,199
Total Employment 6,217
COMPENSATION
Direct $100,344,263
Indirect $169,452,182
Induced $122,449,570
Total $392,246,015
INDUSTRY OUTPUT
Value of Production – Direct $673,844,382
Value Added – Direct $183,783,393
REPRESENTATIVE
Kat Cammack
EMPLOYMENT
Direct 2,398
Indirect 3,297
Induced 2,325
Total Employment 8,020
COMPENSATION
Direct $161,173,443
Indirect $206,502,682
Induced $124,824,355
Total $492,500,481
INDUSTRY OUTPUT
Value of Production – Direct $908,582,373
Value Added – Direct $252,831,647
REPRESENTATIVE
Aaron Bean
EMPLOYMENT
Direct 1,310
Indirect 1,600
Induced 1,351
Total Employment 4,261
COMPENSATION
Direct $117,496,152
Indirect $137,182,146
Induced $83,483,881
Total $338,162,179
INDUSTRY OUTPUT
Value of Production – Direct $640,615,896
Value Added – Direct $210,980,259
REPRESENTATIVE
John Rutherford
EMPLOYMENT
Direct 359
Indirect 410
Induced 389
Total Employment 1,158
COMPENSATION
Direct $33,166,332
Indirect $38,279,655
Induced $24,110,700
Total $95,556,687
INDUSTRY OUTPUT
Value of Production – Direct $216,864,458
Value Added – Direct $75,383,742
REPRESENTATIVE
Michael Waltz
EMPLOYMENT
Direct 859
Indirect 774
Induced 918
Total Employment 2,551
COMPENSATION
Direct $107,080,992
Indirect $53,472,270
Induced $50,631,713
Total $211,184,975
INDUSTRY OUTPUT
Value of Production – Direct $506,783,818
Value Added – Direct $229,939,745
REPRESENTATIVE
Cory Mills
EMPLOYMENT
Direct 581
Indirect 580
Induced 658
Total Employment 1,819
COMPENSATION
Direct $71,551,018
Indirect $46,561,660
Induced $36,501,066
Total $154,613,744
INDUSTRY OUTPUT
Value of Production – Direct $312,843,653
Value Added – Direct $149,531,249
REPRESENTATIVE
Mike Haridopolos
EMPLOYMENT
Direct 269
Indirect 364
Induced 485
Total Employment 1,119
COMPENSATION
Direct $31,830,578
Indirect $29,090,560
Induced $26,475,951
Total $87,397,089
INDUSTRY OUTPUT
Value of Production – Direct $128,627,421
Value Added – Direct $43,715,841
REPRESENTATIVE
Darren Soto
EMPLOYMENT
Direct 617
Indirect 480
Induced 367
Total Employment 1,464
COMPENSATION
Direct $38,774,619
Indirect $34,705,951
Induced $21,423,448
Total $94,904,018
INDUSTRY OUTPUT
Value of Production – Direct $232,704,265
Value Added – Direct $65,721,714
REPRESENTATIVE
Maxwell Frost
EMPLOYMENT
Direct 249
Indirect 148
Induced 173
Total Employment 570
COMPENSATION
Direct $21,148,269
Indirect $12,174,768
Induced $9,978,860
Total $43,301,897
INDUSTRY OUTPUT
Value of Production – Direct $91,163,828
Value Added – Direct $36,151,834
REPRESENTATIVE
Daniel Webster
EMPLOYMENT
Direct 542
Indirect 389
Induced 371
Total Employment 1,302
COMPENSATION
Direct $42,817,086
Indirect $28,606,967
Induced $21,388,291
Total $92,812,344
INDUSTRY OUTPUT
Value of Production – Direct $263,882,593
Value Added – Direct $73,490,841
REPRESENTATIVE
Gus Bilirakis
EMPLOYMENT
Direct 337
Indirect 475
Induced 270
Total Employment 1,082
COMPENSATION
Direct $22,191,000
Indirect $27,563,543
Induced $14,283,904
Total $64,038,446
INDUSTRY OUTPUT
Value of Production – Direct $141,420,991
Value Added – Direct $34,766,309
REPRESENTATIVE
Anna Paulina Luna
EMPLOYMENT
Direct 565
Indirect 639
Induced 636
Total Employment 1,840
COMPENSATION
Direct $51,252,853
Indirect $47,086,518
Induced $37,342,463
Total $135,681,834
INDUSTRY OUTPUT
Value of Production – Direct $247,427,703
Value Added – Direct $87,721,024
REPRESENTATIVE
Kathy Castor
EMPLOYMENT
Direct 492
Indirect 436
Induced 343
Total Employment 1,271
COMPENSATION
Direct $34,534,025
Indirect $36,243,969
Induced $20,241,031
Total $91,019,025
INDUSTRY OUTPUT
Value of Production – Direct $194,369,302
Value Added – Direct $63,192,967
REPRESENTATIVE
Laurel Lee
EMPLOYMENT
Direct 998
Indirect 538
Induced 665
Total Employment 2,200
COMPENSATION
Direct $83,209,799
Indirect $41,429,447
Induced $38,732,669
Total $163,371,915
INDUSTRY OUTPUT
Value of Production – Direct $365,433,033
Value Added – Direct $119,669,789
REPRESENTATIVE
Vern Buchanan
EMPLOYMENT
Direct 234
Indirect 158
Induced 164
Total Employment 556
COMPENSATION
Direct $19,168,312
Indirect $12,002,882
Induced $9,465,781
Total $40,636,975
INDUSTRY OUTPUT
Value of Production – Direct $88,559,464
Value Added – Direct $32,761,151
REPRESENTATIVE
Greg Steube
EMPLOYMENT
Direct 400
Indirect 384
Induced 383
Total Employment 1,166
COMPENSATION
Direct $30,343,440
Indirect $28,343,788
Induced $21,985,368
Total $80,672,596
INDUSTRY OUTPUT
Value of Production – Direct $148,755,975
Value Added – Direct $49,400,237
REPRESENTATIVE
Scott Franklin
EMPLOYMENT
Direct 1,578
Indirect 1,452
Induced 1,102
Total Employment 4,132
COMPENSATION
Direct $103,868,539
Indirect $102,373,925
Induced $63,588,083
Total $269,830,547
INDUSTRY OUTPUT
Value of Production – Direct $596,617,040
Value Added – Direct $160,540,896
REPRESENTATIVE
Byron Donalds
EMPLOYMENT
Direct 293
Indirect 329
Induced 333
Total Employment 955
COMPENSATION
Direct $28,476,080
Indirect $26,419,954
Induced $19,282,835
Total $74,178,868
INDUSTRY OUTPUT
Value of Production – Direct $120,293,667
Value Added – Direct $45,152,515
REPRESENTATIVE
Sheila Cherfilus-McCormick
EMPLOYMENT
Direct 441
Indirect 189
Induced 187
Total Employment 817
COMPENSATION
Direct $31,999,266
Indirect $16,427,981
Induced $11,539,836
Total $59,967,083
INDUSTRY OUTPUT
Value of Production – Direct $153,700,892
Value Added – Direct $48,664,317
REPRESENTATIVE
Brian Mast
EMPLOYMENT
Direct 954
Indirect 904
Induced 630
Total Employment 2,489
COMPENSATION
Direct $69,506,604
Indirect $71,974,505
Induced $37,995,791
Total $179,476,899
INDUSTRY OUTPUT
Value of Production – Direct $376,965,637
Value Added – Direct $112,603,492
REPRESENTATIVE
Lois Frankel
EMPLOYMENT
Direct 366
Indirect 164
Induced 177
Total Employment 707
COMPENSATION
Direct $27,682,143
Indirect $13,837,996
Induced $10,885,929
Total $52,406,068
INDUSTRY OUTPUT
Value of Production – Direct $138,544,695
Value Added – Direct $46,544,197
REPRESENTATIVE
Jared Moskowitz
EMPLOYMENT
Direct 375
Indirect 199
Induced 194
Total Employment 768
COMPENSATION
Direct $34,962,766
Indirect $17,656,926
Induced $12,050,647
Total $64,670,338
INDUSTRY OUTPUT
Value of Production – Direct $158,316,995
Value Added – Direct $54,479,046
REPRESENTATIVE
Frederica Wilson
EMPLOYMENT
Direct 189
Indirect 73
Induced 78
Total Employment 340
COMPENSATION
Direct $14,387,210
Indirect $5,828,533
Induced $4,817,266
Total $25,033,009
INDUSTRY OUTPUT
Value of Production – Direct $72,149,904
Value Added – Direct $24,880,329
REPRESENTATIVE
Debbie Wasserman Schultz
EMPLOYMENT
Direct 109
Indirect 43
Induced 47
Total Employment 198
COMPENSATION
Direct $9,630,972
Indirect $3,535,855
Induced $2,773,684
Total $15,940,512
INDUSTRY OUTPUT
Value of Production – Direct $39,189,505
Value Added – Direct $15,120,907
REPRESENTATIVE
Mario Díaz-Balart
EMPLOYMENT
Direct 462
Indirect 279
Induced 213
Total Employment 954
COMPENSATION
Direct $35,091,181
Indirect $21,506,721
Induced $13,174,065
Total $69,771,968
INDUSTRY OUTPUT
Value of Production – Direct $169,345,625
Value Added – Direct $56,366,966
REPRESENTATIVE
María Elvira Salazar
EMPLOYMENT
Direct 102
Indirect 50
Induced 41
Total Employment 194
COMPENSATION
Direct $6,993,301
Indirect $4,092,686
Induced $2,577,503
Total $13,663,491
INDUSTRY OUTPUT
Value of Production – Direct $39,828,235
Value Added – Direct $12,213,691
REPRESENTATIVE
Carlos Giménez
EMPLOYMENT
Direct 92
Indirect 47
Induced 41
Total Employment 180
COMPENSATION
Direct $6,768,891
Indirect $3,797,291
Induced $2,537,482
Total $13,103,665
INDUSTRY OUTPUT
Value of Production – Direct $39,936,702
Value Added – Direct $13,313,285
REPRESENTATIVE
Trent Kelly
EMPLOYMENT
Direct 1,460
Indirect 2,283
Induced 1,687
Total Employment 5,429
COMPENSATION
Direct $118,180,478
Indirect $130,628,538
Induced $84,795,710
Total $333,604,727
INDUSTRY OUTPUT
Value of Production – Direct $722,118,174
Value Added – Direct $259,452,808
EMPLOYMENT
Direct 9,283
Indirect 12,571
Induced 8,161
Total Employment 30,015
COMPENSATION
Direct $712,767,106
Indirect $761,034,628
Induced $404,971,782
Total $1,878,773,516
INDUSTRY OUTPUT
Value of Production – Direct $4,897,103,517
Value Added – Direct $1,638,447,408
REPRESENTATIVE
Bennie Thompson
EMPLOYMENT
Direct 2,258
Indirect 3,026
Induced 1,744
Total Employment 7,028
COMPENSATION
Direct $163,544,224
Indirect $176,945,140
Induced $86,098,949
Total $426,588,312
INDUSTRY OUTPUT
Value of Production – Direct $1,125,534,029
Value Added – Direct $337,201,060
REPRESENTATIVE
Michael Guest
EMPLOYMENT
Direct 3,511
Indirect 4,357
Induced 2,656
Total Employment 10,523
COMPENSATION
Direct $270,145,192
Indirect $269,404,544
Induced $128,255,356
Total $667,805,093
INDUSTRY OUTPUT
Value of Production – Direct $1,778,495,902
Value Added – Direct $602,366,504
REPRESENTATIVE
Mike Ezell
EMPLOYMENT
Direct 2,055
Indirect 2,906
Induced 2,074
Total Employment 7,035
COMPENSATION
Direct $160,897,212
Indirect $184,056,406
Induced $105,821,767
Total $450,775,384
INDUSTRY OUTPUT
Value of Production – Direct $1,270,955,413
Value Added – Direct $439,427,036
REPRESENTATIVE
Barry Moore
EMPLOYMENT
Direct 2,026
Indirect 3,624
Induced 3,688
Total Employment 9,338
COMPENSATION
Direct $275,393,373
Indirect $232,347,823
Induced $189,434,335
Total $697,175,531
INDUSTRY OUTPUT
Value of Production – Direct $1,169,388,632
Value Added – Direct $430,300,508
EMPLOYMENT
Direct 19,500
Indirect 21,237
Induced 16,415
Total Employment 57,152
COMPENSATION
Direct $1,709,412,110
Indirect $1,379,920,823
Induced $872,498,795
Total $3,961,831,728
INDUSTRY OUTPUT
Value of Production – Direct $9,329,197,953
Value Added – Direct $2,978,129,192
REPRESENTATIVE
Shomari Figures
EMPLOYMENT
Direct 2,364
Indirect 2,762
Induced 1,999
Total Employment 7,125
COMPENSATION
Direct $187,001,243
Indirect $170,063,775
Induced $102,773,227
Total $459,838,245
INDUSTRY OUTPUT
Value of Production – Direct $1,062,701,130
Value Added – Direct $323,384,431
REPRESENTATIVE
Mike Rogers
EMPLOYMENT
Direct 2,250
Indirect 2,850
Induced 1,914
Total Employment 7,015
COMPENSATION
Direct $176,051,187
Indirect $179,292,756
Induced $100,110,640
Total $455,454,583
INDUSTRY OUTPUT
Value of Production – Direct $1,290,005,406
Value Added – Direct $396,529,551
REPRESENTATIVE
Robert Aderholt
EMPLOYMENT
Direct 6,439
Indirect 5,580
Induced 4,320
Total Employment 16,338
COMPENSATION
Direct $559,719,389
Indirect $335,146,163
Induced $228,015,862
Total $1,122,881,413
INDUSTRY OUTPUT
Value of Production – Direct $2,667,786,433
Value Added – Direct $846,640,105
REPRESENTATIVE
Dale Strong
EMPLOYMENT
Direct 1,182
Indirect 1,145
Induced 1,002
Total Employment 3,328
COMPENSATION
Direct $95,729,309
Indirect $79,936,236
Induced $54,713,146
Total $230,378,691
INDUSTRY OUTPUT
Value of Production – Direct $436,063,705
Value Added – Direct $149,088,576
REPRESENTATIVE
Gary Palmer
EMPLOYMENT
Direct 1,037
Indirect 981
Induced 619
Total Employment 2,638
COMPENSATION
Direct $93,821,640
Indirect $75,952,235
Induced $34,810,274
Total $204,584,148
INDUSTRY OUTPUT
Value of Production – Direct $517,160,907
Value Added – Direct $171,116,203
REPRESENTATIVE
Terri Sewell
EMPLOYMENT
Direct 4,203
Indirect 4,295
Induced 2,872
Total Employment 11,370
COMPENSATION
Direct $321,695,970
Indirect $307,181,835
Induced $162,641,312
Total $791,519,117
INDUSTRY OUTPUT
Value of Production – Direct $2,186,091,739
Value Added – Direct $661,069,818
REPRESENTATIVE
Buddy Carter
EMPLOYMENT
Direct 2,249
Indirect 3,488
Induced 2,916
Total Employment 8,653
COMPENSATION
Direct $164,414,878
Indirect $247,092,556
Induced $165,467,470
Total $576,974,904
INDUSTRY OUTPUT
Value of Production – Direct $1,077,916,993
Value Added – Direct $345,610,025
EMPLOYMENT
Direct 22,754
Indirect 24,637
Induced 19,669
Total Employment 67,060
COMPENSATION
Direct $1,791,148,372
Indirect $1,718,927,847
Induced $1,110,061,779
Total $4,620,137,999
INDUSTRY OUTPUT
Value of Production – Direct $10,601,929,291
Value Added – Direct $3,864,727,285
REPRESENTATIVE
Sanford Bishop
EMPLOYMENT
Direct 2,329
Indirect 2,918
Induced 2,407
Total Employment 7,653
COMPENSATION
Direct $180,908,167
Indirect $194,602,252
Induced $133,920,836
Total $509,431,255
INDUSTRY OUTPUT
Value of Production – Direct $1,130,338,590
Value Added – Direct $411,123,338
REPRESENTATIVE
Brian Jack
EMPLOYMENT
Direct 1,115
Indirect 1,028
Induced 793
Total Employment 2,935
COMPENSATION
Direct $79,698,958
Indirect $70,027,068
Induced $44,858,469
Total $194,584,495
INDUSTRY OUTPUT
Value of Production – Direct $448,895,128
Value Added – Direct $158,184,939
REPRESENTATIVE
Hank Johnson
EMPLOYMENT
Direct 647
Indirect 554
Induced 398
Total Employment 1,598
COMPENSATION
Direct $57,437,264
Indirect $46,661,039
Induced $24,790,817
Total $128,889,120
INDUSTRY OUTPUT
Value of Production – Direct $316,355,800
Value Added – Direct $120,733,271
REPRESENTATIVE
Nikema Williams
EMPLOYMENT
Direct 1,582
Indirect 690
Induced 1,116
Total Employment 3,389
COMPENSATION
Direct $211,570,525
Indirect $67,598,075
Induced $72,020,647
Total $351,189,247
INDUSTRY OUTPUT
Value of Production – Direct $811,744,704
Value Added – Direct $449,876,580
REPRESENTATIVE
Lucy McBath
EMPLOYMENT
Direct 691
Indirect 342
Induced 339
Total Employment 1,371
COMPENSATION
Direct $59,597,157
Indirect $34,209,135
Induced $21,758,430
Total $115,564,722
INDUSTRY OUTPUT
Value of Production – Direct $280,113,090
Value Added – Direct $113,377,199
REPRESENTATIVE
Richard McCormick
EMPLOYMENT
Direct 1,038
Indirect 747
Induced 578
Total Employment 2,362
COMPENSATION
Direct $85,423,838
Indirect $67,061,953
Induced $35,606,828
Total $188,092,619
INDUSTRY OUTPUT
Value of Production – Direct $409,662,444
Value Added – Direct $162,406,697
REPRESENTATIVE
Austin Scott
EMPLOYMENT
Direct 4,351
Indirect 5,395
Induced 3,678
Total Employment 13,423
COMPENSATION
Direct $302,222,805
Indirect $353,302,855
Induced $188,371,207
Total $843,896,867
INDUSTRY OUTPUT
Value of Production – Direct $2,166,155,614
Value Added – Direct $708,778,653
REPRESENTATIVE
Andrew Clyde
EMPLOYMENT
Direct 1,536
Indirect 1,352
Induced 993
Total Employment 3,882
COMPENSATION
Direct $108,718,414
Indirect $101,664,926
Induced $58,952,852
Total $269,336,191
INDUSTRY OUTPUT
Value of Production – Direct $638,552,292
Value Added – Direct $223,824,051
REPRESENTATIVE
Mike Collins
EMPLOYMENT
Direct 1,792
Indirect 1,804
Induced 1,276
Total Employment 4,872
COMPENSATION
Direct $127,935,449
Indirect $116,469,526
Induced $69,625,317
Total $314,030,291
INDUSTRY OUTPUT
Value of Production – Direct $797,397,426
Value Added – Direct $290,537,422
REPRESENTATIVE
Barry Loudermilk
EMPLOYMENT
Direct 751
Indirect 507
Induced 366
Total Employment 1,624
COMPENSATION
Direct $55,309,087
Indirect $41,164,137
Induced $22,564,314
Total $119,037,538
INDUSTRY OUTPUT
Value of Production – Direct $293,172,924
Value Added – Direct $108,588,140
REPRESENTATIVE
Rick Allen
EMPLOYMENT
Direct 2,810
Indirect 4,209
Induced 3,515
Total Employment 10,534
COMPENSATION
Direct $207,569,036
Indirect $262,562,920
Induced $192,974,637
Total $663,106,593
INDUSTRY OUTPUT
Value of Production – Direct $1,382,524,997
Value Added – Direct $463,957,802
REPRESENTATIVE
David Scott
EMPLOYMENT
Direct 567
Indirect 327
Induced 354
Total Employment 1,248
COMPENSATION
Direct $56,666,008
Indirect $26,275,486
Induced $21,598,921
Total $104,540,415
INDUSTRY OUTPUT
Value of Production – Direct $270,268,430
Value Added – Direct $112,822,771
REPRESENTATIVE
Marjorie Taylor Greene
EMPLOYMENT
Direct 1,296
Indirect 1,278
Induced 941
Total Employment 3,515
COMPENSATION
Direct $93,676,788
Indirect $90,235,920
Induced $57,551,033
Total $241,463,741
INDUSTRY OUTPUT
Value of Production – Direct $578,830,859
Value Added – Direct $194,906,398
REPRESENTATIVE
Nancy Mace
EMPLOYMENT
Direct 533
Indirect 685
Induced 410
Total Employment 1,627
COMPENSATION
Direct $42,289,869
Indirect $48,063,150
Induced $22,790,864
Total $113,143,882
INDUSTRY OUTPUT
Value of Production – Direct $295,887,754
Value Added – Direct $74,921,072
EMPLOYMENT
Direct 9,960
Indirect 11,915
Induced 8,260
Total Employment 30,135
COMPENSATION
Direct $781,562,859
Indirect $772,513,556
Induced $438,634,052
Total $1,992,710,466
INDUSTRY OUTPUT
Value of Production – Direct $4,603,845,282
Value Added – Direct $1,273,879,384
REPRESENTATIVE
Joe Wilson
EMPLOYMENT
Direct 1,005
Indirect 942
Induced 608
Total Employment 2,554
COMPENSATION
Direct $72,004,736
Indirect $61,695,751
Induced $32,399,220
Total $166,099,707
INDUSTRY OUTPUT
Value of Production – Direct $358,487,154
Value Added – Direct $103,351,057
REPRESENTATIVE
Sheri Biggs
EMPLOYMENT
Direct 2,552
Indirect 2,596
Induced 1,928
Total Employment 7,076
COMPENSATION
Direct $197,487,029
Indirect $162,615,655
Induced $98,938,502
Total $459,041,186
INDUSTRY OUTPUT
Value of Production – Direct $1,064,327,458
Value Added – Direct $303,105,367
REPRESENTATIVE
William Timmons
EMPLOYMENT
Direct 617
Indirect 717
Induced 545
Total Employment 1,879
COMPENSATION
Direct $51,906,618
Indirect $48,229,908
Induced $28,255,162
Total $128,391,688
INDUSTRY OUTPUT
Value of Production – Direct $228,322,456
Value Added – Direct $73,143,257
REPRESENTATIVE
Ralph Norman
EMPLOYMENT
Direct 1,652
Indirect 1,934
Induced 1,486
Total Employment 5,072
COMPENSATION
Direct $138,861,710
Indirect $135,228,882
Induced $81,985,402
Total $356,075,994
INDUSTRY OUTPUT
Value of Production – Direct $815,324,686
Value Added – Direct $239,976,747
REPRESENTATIVE
Jim Clyburn
EMPLOYMENT
Direct 1,515
Indirect 1,723
Induced 1,152
Total Employment 4,391
COMPENSATION
Direct $119,841,774
Indirect $123,841,495
Induced $63,258,424
Total $306,941,693
INDUSTRY OUTPUT
Value of Production – Direct $846,807,793
Value Added – Direct $219,615,079
REPRESENTATIVE
Russell Fry
EMPLOYMENT
Direct 2,085
Indirect 3,318
Induced 2,132
Total Employment 7,535
COMPENSATION
Direct $159,171,124
Indirect $192,838,715
Induced $111,006,477
Total $463,016,316
INDUSTRY OUTPUT
Value of Production – Direct $994,687,981
Value Added – Direct $259,766,807
REPRESENTATIVE
Don Davis
EMPLOYMENT
Direct 2,066
Indirect 2,387
Induced 1,519
Total Employment 5,972
COMPENSATION
Direct $127,012,184
Indirect $153,434,119
Induced $85,739,922
Total $366,186,225
INDUSTRY OUTPUT
Value of Production – Direct $834,835,275
Value Added – Direct $240,740,274
EMPLOYMENT
Direct 19,888
Indirect 19,701
Induced 14,707
Total Employment 54,296
COMPENSATION
Direct $1,457,145,641
Indirect $1,384,396,285
Induced $859,071,117
Total $3,700,613,043
INDUSTRY OUTPUT
Value of Production – Direct $8,423,130,927
Value Added – Direct $2,890,951,591
REPRESENTATIVE
Deborah Ross
EMPLOYMENT
Direct 123
Indirect 99
Induced 72
Total Employment 295
COMPENSATION
Direct $10,522,862
Indirect $8,091,712
Induced $4,530,706
Total $23,145,281
INDUSTRY OUTPUT
Value of Production – Direct $46,683,036
Value Added – Direct $17,075,860
REPRESENTATIVE
Greg Murphy
EMPLOYMENT
Direct 1,261
Indirect 1,157
Induced 969
Total Employment 3,387
COMPENSATION
Direct $80,220,024
Indirect $75,421,355
Induced $53,527,937
Total $209,169,316
INDUSTRY OUTPUT
Value of Production – Direct $515,285,100
Value Added – Direct $170,511,159
REPRESENTATIVE
Valerie Foushee
EMPLOYMENT
Direct 750
Indirect 742
Induced 541
Total Employment 2,033
COMPENSATION
Direct $59,574,410
Indirect $63,397,895
Induced $34,336,958
Total $157,309,263
INDUSTRY OUTPUT
Value of Production – Direct $340,240,296
Value Added – Direct $117,375,949
REPRESENTATIVE
Virginia Foxx
EMPLOYMENT
Direct 1,460
Indirect 1,776
Induced 1,263
Total Employment 4,499
COMPENSATION
Direct $91,093,155
Indirect $125,588,072
Induced $75,174,854
Total $291,856,081
INDUSTRY OUTPUT
Value of Production – Direct $742,547,664
Value Added – Direct $228,065,592
REPRESENTATIVE
Addison McDowell
EMPLOYMENT
Direct 636
Indirect 949
Induced 653
Total Employment 2,238
COMPENSATION
Direct $53,075,930
Indirect $69,066,288
Induced $38,085,115
Total $160,227,333
INDUSTRY OUTPUT
Value of Production – Direct $332,234,504
Value Added – Direct $118,337,697
REPRESENTATIVE
David Rouzer
EMPLOYMENT
Direct 927
Indirect 984
Induced 842
Total Employment 2,753
COMPENSATION
Direct $63,983,129
Indirect $65,096,936
Induced $46,718,703
Total $175,798,769
INDUSTRY OUTPUT
Value of Production – Direct $342,831,072
Value Added – Direct $117,804,896
REPRESENTATIVE
Mark Harris
EMPLOYMENT
Direct 4,541
Indirect 4,039
Induced 2,788
Total Employment 11,369
COMPENSATION
Direct $362,127,795
Indirect $290,306,636
Induced $163,069,141
Total $815,503,572
INDUSTRY OUTPUT
Value of Production – Direct $1,916,335,047
Value Added – Direct $696,021,422
REPRESENTATIVE
Richard Hudson
EMPLOYMENT
Direct 3,003
Indirect 2,047
Induced 1,898
Total Employment 6,948
COMPENSATION
Direct $220,763,269
Indirect $142,717,700
Induced $110,580,627
Total $474,061,596
INDUSTRY OUTPUT
Value of Production – Direct $1,245,447,857
Value Added – Direct $442,213,500
REPRESENTATIVE
Pat Harrigan
EMPLOYMENT
Direct 1,585
Indirect 1,792
Induced 1,188
Total Employment 4,565
COMPENSATION
Direct $105,819,434
Indirect $127,220,628
Induced $68,201,632
Total $301,241,695
INDUSTRY OUTPUT
Value of Production – Direct $623,974,764
Value Added – Direct $205,802,667
REPRESENTATIVE
Chuck Edwards
EMPLOYMENT
Direct 1,259
Indirect 2,039
Induced 1,501
Total Employment 4,799
COMPENSATION
Direct $79,988,729
Indirect $128,042,105
Induced $84,865,586
Total $292,896,420
INDUSTRY OUTPUT
Value of Production – Direct $549,995,638
Value Added – Direct $165,396,579
REPRESENTATIVE
Alma Adams
EMPLOYMENT
Direct 455
Indirect 267
Induced 275
Total Employment 998
COMPENSATION
Direct $43,867,013
Indirect $21,387,753
Induced $17,785,634
Total $83,040,400
INDUSTRY OUTPUT
Value of Production – Direct $156,398,434
Value Added – Direct $68,389,439
REPRESENTATIVE
Brad Knott
EMPLOYMENT
Direct 1,053
Indirect 763
Induced 595
Total Employment 2,410
COMPENSATION
Direct $76,118,606
Indirect $57,729,470
Induced $36,647,047
Total $170,495,123
INDUSTRY OUTPUT
Value of Production – Direct $476,748,218
Value Added – Direct $171,856,599
REPRESENTATIVE
Tim Moore
EMPLOYMENT
Direct 769
Indirect 660
Induced 602
Total Employment 2,031
COMPENSATION
Direct $82,979,100
Indirect $56,895,615
Induced $39,807,255
Total $179,681,970
INDUSTRY OUTPUT
Value of Production – Direct $299,574,022
Value Added – Direct $131,359,957
REPRESENTATIVE
Rob Wittman
EMPLOYMENT
Direct 829
Indirect 538
Induced 401
Total Employment 1,768
COMPENSATION
Direct $58,105,890
Indirect $43,945,927
Induced $24,918,701
Total $126,970,518
INDUSTRY OUTPUT
Value of Production – Direct $342,508,364
Value Added – Direct $102,131,463
EMPLOYMENT
Direct 15,178
Indirect 14,072
Induced 10,169
Total Employment 39,420
COMPENSATION
Direct $1,047,842,756
Indirect $1,064,523,397
Induced $608,532,827
Total $2,720,898,980
INDUSTRY OUTPUT
Value of Production – Direct $6,389,068,723
Value Added – Direct $1,987,996,011
REPRESENTATIVE
Jen Kiggans
EMPLOYMENT
Direct 381
Indirect 324
Induced 342
Total Employment 1,046
COMPENSATION
Direct $42,942,537
Indirect $23,002,402
Induced $19,693,771
Total $85,638,710
INDUSTRY OUTPUT
Value of Production – Direct $176,967,148
Value Added – Direct $75,262,726
REPRESENTATIVE
Bobby Scott
EMPLOYMENT
Direct 331
Indirect 274
Induced 275
Total Employment 879
COMPENSATION
Direct $31,687,808
Indirect $20,575,286
Induced $16,137,555
Total $68,400,649
INDUSTRY OUTPUT
Value of Production – Direct $141,820,542
Value Added – Direct $54,574,846
REPRESENTATIVE
Jennifer McClellan
EMPLOYMENT
Direct 1,259
Indirect 1,088
Induced 662
Total Employment 3,008
COMPENSATION
Direct $90,707,138
Indirect $93,392,184
Induced $41,498,533
Total $225,597,855
INDUSTRY OUTPUT
Value of Production – Direct $496,493,611
Value Added – Direct $161,615,759
REPRESENTATIVE
John McGuire
EMPLOYMENT
Direct 3,259
Indirect 3,264
Induced 2,215
Total Employment 8,738
COMPENSATION
Direct $234,993,128
Indirect $266,819,615
Induced $134,442,709
Total $636,255,452
INDUSTRY OUTPUT
Value of Production – Direct $1,664,658,784
Value Added – Direct $511,283,348
REPRESENTATIVE
Ben Cline
EMPLOYMENT
Direct 3,006
Indirect 3,210
Induced 2,284
Total Employment 8,500
COMPENSATION
Direct $191,796,652
Indirect $246,741,181
Induced $136,093,012
Total $574,630,845
INDUSTRY OUTPUT
Value of Production – Direct $1,122,573,046
Value Added – Direct $339,499,452
REPRESENTATIVE
Eugene Vindman
EMPLOYMENT
Direct 977
Indirect 890
Induced 539
Total Employment 2,407
COMPENSATION
Direct $76,139,212
Indirect $59,596,873
Induced $32,252,107
Total $167,988,192
INDUSTRY OUTPUT
Value of Production – Direct $460,308,906
Value Added – Direct $146,807,758
REPRESENTATIVE
Don Beyer
EMPLOYMENT
Direct 16
Indirect 6
Induced 11
Total Employment 33
COMPENSATION
Direct $2,047,271
Indirect $711,285
Induced $836,975
Total $3,595,531
INDUSTRY OUTPUT
Value of Production – Direct $6,041,793
Value Added – Direct $2,853,121
REPRESENTATIVE
Morgan Griffith
EMPLOYMENT
Direct 4,675
Indirect 4,107
Induced 3,175
Total Employment 11,957
COMPENSATION
Direct $279,557,576
Indirect $279,826,932
Induced $185,378,004
Total $744,762,512
INDUSTRY OUTPUT
Value of Production – Direct $1,787,500,734
Value Added – Direct $519,072,732
REPRESENTATIVE
Suhas Subramanyam
EMPLOYMENT
Direct 435
Indirect 366
Induced 257
Total Employment 1,058
COMPENSATION
Direct $38,153,580
Indirect $29,219,491
Induced $16,641,840
Total $84,014,911
INDUSTRY OUTPUT
Value of Production – Direct $185,322,229
Value Added – Direct $72,334,540
REPRESENTATIVE
Gerry Connolly
EMPLOYMENT
Direct 11
Indirect 6
Induced 9
Total Employment 25
COMPENSATION
Direct $1,711,964
Indirect $692,221
Induced $639,620
Total $3,043,805
INDUSTRY OUTPUT
Value of Production – Direct $4,873,567
Value Added – Direct $2,560,264
REPRESENTATIVE
Diana Harshbarger
EMPLOYMENT
Direct 1,724
Indirect 1,796
Induced 1,654
Total Employment 5,174
COMPENSATION
Direct $113,954,430
Indirect $116,239,179
Induced $99,741,251
Total $329,934,859
INDUSTRY OUTPUT
Value of Production – Direct $650,161,645
Value Added – Direct $216,585,572
EMPLOYMENT
Direct 14,711
Indirect 12,873
Induced 10,713
Total Employment 38,297
COMPENSATION
Direct $1,060,454,951
Indirect $949,705,902
Induced $671,582,820
Total $2,681,743,674
INDUSTRY OUTPUT
Value of Production – Direct $5,543,790,909
Value Added – Direct $1,830,386,809
REPRESENTATIVE
Tim Burchett
EMPLOYMENT
Direct 2,073
Indirect 2,192
Induced 2,097
Total Employment 6,363
COMPENSATION
Direct $177,585,657
Indirect $162,152,836
Induced $133,653,848
Total $473,392,342
INDUSTRY OUTPUT
Value of Production – Direct $759,555,510
Value Added – Direct $256,721,638
REPRESENTATIVE
Chuck Fleischmann
EMPLOYMENT
Direct 1,041
Indirect 1,064
Induced 1,013
Total Employment 3,118
COMPENSATION
Direct $79,046,642
Indirect $80,559,365
Induced $62,021,176
Total $221,627,184
INDUSTRY OUTPUT
Value of Production – Direct $403,053,570
Value Added – Direct $135,828,403
REPRESENTATIVE
Scott DesJarlais
EMPLOYMENT
Direct 1,710
Indirect 1,482
Induced 1,054
Total Employment 4,246
COMPENSATION
Direct $115,746,155
Indirect $107,110,258
Induced $63,724,415
Total $286,580,828
INDUSTRY OUTPUT
Value of Production – Direct $730,188,596
Value Added – Direct $241,070,107
REPRESENTATIVE
Andy Ogles
EMPLOYMENT
Direct 538
Indirect 259
Induced 234
Total Employment 1,032
COMPENSATION
Direct $41,510,741
Indirect $22,118,073
Induced $15,840,554
Total $79,469,368
INDUSTRY OUTPUT
Value of Production – Direct $199,495,486
Value Added – Direct $72,758,597
REPRESENTATIVE
John Rose
EMPLOYMENT
Direct 2,285
Indirect 1,793
Induced 1,085
Total Employment 5,164
COMPENSATION
Direct $144,779,270
Indirect $136,183,940
Induced $71,661,362
Total $352,624,573
INDUSTRY OUTPUT
Value of Production – Direct $857,202,651
Value Added – Direct $256,418,944
REPRESENTATIVE
Mark Green
EMPLOYMENT
Direct 1,626
Indirect 1,199
Induced 804
Total Employment 3,629
COMPENSATION
Direct $115,598,398
Indirect $101,153,549
Induced $55,950,171
Total $272,702,119
INDUSTRY OUTPUT
Value of Production – Direct $613,094,008
Value Added – Direct $206,664,205
REPRESENTATIVE
David Kustoff
EMPLOYMENT
Direct 3,125
Indirect 2,589
Induced 2,301
Total Employment 8,015
COMPENSATION
Direct $229,175,566
Indirect $185,420,531
Induced $139,581,793
Total $554,177,891
INDUSTRY OUTPUT
Value of Production – Direct $1,151,459,403
Value Added – Direct $373,734,559
REPRESENTATIVE
Steve Cohen
EMPLOYMENT
Direct 589
Indirect 498
Induced 470
Total Employment 1,556
COMPENSATION
Direct $43,058,092
Indirect $38,768,171
Induced $29,408,249
Total $111,234,512
INDUSTRY OUTPUT
Value of Production – Direct $179,580,041
Value Added – Direct $70,604,786
REPRESENTATIVE
James Comer
EMPLOYMENT
Direct 2,832
Indirect 2,035
Induced 2,156
Total Employment 7,023
COMPENSATION
Direct $205,715,340
Indirect $153,228,112
Induced $124,926,281
Total $483,869,733
INDUSTRY OUTPUT
Value of Production – Direct $972,672,199
Value Added – Direct $262,019,570
EMPLOYMENT
Direct 11,438
Indirect 9,685
Induced 8,482
Total Employment 29,605
COMPENSATION
Direct $790,386,901
Indirect $704,215,133
Induced $489,691,459
Total $1,984,293,493
INDUSTRY OUTPUT
Value of Production – Direct $4,095,109,465
Value Added – Direct $1,049,828,341
REPRESENTATIVE
Brett Guthrie
EMPLOYMENT
Direct 2,254
Indirect 1,860
Induced 1,476
Total Employment 5,590
COMPENSATION
Direct $161,001,419
Indirect $136,269,045
Induced $84,712,770
Total $381,983,234
INDUSTRY OUTPUT
Value of Production – Direct $866,733,448
Value Added – Direct $216,578,513
REPRESENTATIVE
Morgan McGarvey
EMPLOYMENT
Direct 812
Indirect 777
Induced 728
Total Employment 2,317
COMPENSATION
Direct $62,056,994
Indirect $69,162,124
Induced $46,624,653
Total $177,843,771
INDUSTRY OUTPUT
Value of Production – Direct $289,469,688
Value Added – Direct $83,574,726
REPRESENTATIVE
Thomas Massie
EMPLOYMENT
Direct 751
Indirect 875
Induced 663
Total Employment 2,289
COMPENSATION
Direct $50,976,219
Indirect $68,842,085
Induced $40,869,477
Total $160,687,781
INDUSTRY OUTPUT
Value of Production – Direct $293,610,346
Value Added – Direct $67,284,508
REPRESENTATIVE
Hal Rogers
EMPLOYMENT
Direct 3,642
Indirect 2,976
Induced 2,473
Total Employment 9,091
COMPENSATION
Direct $222,318,752
Indirect $193,410,851
Induced $137,204,231
Total $552,933,833
INDUSTRY OUTPUT
Value of Production – Direct $1,251,655,008
Value Added – Direct $304,642,397
REPRESENTATIVE
Andy Barr
EMPLOYMENT
Direct 1,147
Indirect 1,162
Induced 986
Total Employment 3,295
COMPENSATION
Direct $88,318,177
Indirect $83,302,917
Induced $55,354,047
Total $226,975,141
INDUSTRY OUTPUT
Value of Production – Direct $420,968,775
Value Added – Direct $115,728,627
REPRESENTATIVE
Steve Scalise
EMPLOYMENT
Direct 260
Indirect 219
Induced 160
Total Employment 640
COMPENSATION
Direct $20,543,936
Indirect $16,903,677
Induced $9,192,867
Total $46,640,480
INDUSTRY OUTPUT
Value of Production – Direct $104,066,894
Value Added – Direct $38,142,459
EMPLOYMENT
Direct 8,394
Indirect 9,290
Induced 7,476
Total Employment 25,160
COMPENSATION
Direct $679,937,063
Indirect $612,782,610
Induced $395,066,414
Total $1,687,786,087
INDUSTRY OUTPUT
Value of Production – Direct $4,715,987,625
Value Added – Direct $1,920,594,190
REPRESENTATIVE
Troy Carter
EMPLOYMENT
Direct 183
Indirect 137
Induced 154
Total Employment 474
COMPENSATION
Direct $24,996,789
Indirect $11,147,999
Induced $8,841,347
Total $44,986,136
INDUSTRY OUTPUT
Value of Production – Direct $114,962,821
Value Added – Direct $55,924,803
REPRESENTATIVE
Clay Higgins
EMPLOYMENT
Direct 418
Indirect 414
Induced 400
Total Employment 1,232
COMPENSATION
Direct $32,729,563
Indirect $27,533,937
Induced $20,866,395
Total $81,129,895
INDUSTRY OUTPUT
Value of Production – Direct $163,822,910
Value Added – Direct $66,001,743
REPRESENTATIVE
Mike Johnson
EMPLOYMENT
Direct 3,461
Indirect 3,936
Induced 3,061
Total Employment 10,458
COMPENSATION
Direct $251,406,759
Indirect $254,328,385
Induced $161,211,758
Total $666,946,903
INDUSTRY OUTPUT
Value of Production – Direct $1,885,245,197
Value Added – Direct $743,067,565
REPRESENTATIVE
Julia Letlow
EMPLOYMENT
Direct 3,592
Indirect 4,185
Induced 3,360
Total Employment 11,137
COMPENSATION
Direct $310,348,959
Indirect $273,557,323
Induced $175,921,097
Total $759,827,378
INDUSTRY OUTPUT
Value of Production – Direct $2,222,014,226
Value Added – Direct $928,916,328
REPRESENTATIVE
Cleo Fields
EMPLOYMENT
Direct 479
Indirect 400
Induced 341
Total Employment 1,220
COMPENSATION
Direct $39,911,057
Indirect $29,311,289
Induced $19,032,950
Total $88,255,295
INDUSTRY OUTPUT
Value of Production – Direct $225,875,578
Value Added – Direct $88,541,293
REPRESENTATIVE
Rick Crawford
EMPLOYMENT
Direct 1,292
Indirect 1,493
Induced 987
Total Employment 3,772
COMPENSATION
Direct $73,849,400
Indirect $92,061,464
Induced $52,736,839
Total $218,647,702
INDUSTRY OUTPUT
Value of Production – Direct $598,279,198
Value Added – Direct $178,313,607
EMPLOYMENT
Direct 10,728
Indirect 12,093
Induced 8,415
Total Employment 31,236
COMPENSATION
Direct $733,043,508
Indirect $786,687,298
Induced $445,052,486
Total $1,964,783,292
INDUSTRY OUTPUT
Value of Production – Direct $5,740,641,534
Value Added – Direct $2,013,771,345
REPRESENTATIVE
French Hill
EMPLOYMENT
Direct 1,022
Indirect 1,491
Induced 858
Total Employment 3,371
COMPENSATION
Direct $65,816,370
Indirect $99,898,644
Induced $44,838,077
Total $210,553,091
INDUSTRY OUTPUT
Value of Production – Direct $555,798,359
Value Added – Direct $194,338,653
REPRESENTATIVE
Steve Womack
EMPLOYMENT
Direct 1,051
Indirect 1,513
Induced 958
Total Employment 3,522
COMPENSATION
Direct $66,581,905
Indirect $114,424,040
Induced $54,558,712
Total $235,564,657
INDUSTRY OUTPUT
Value of Production – Direct $535,297,780
Value Added – Direct $187,709,512
REPRESENTATIVE
Bruce Westerman
EMPLOYMENT
Direct 7,362
Indirect 7,597
Induced 5,612
Total Employment 20,571
COMPENSATION
Direct $526,795,833
Indirect $480,303,151
Induced $292,918,858
Total $1,300,017,842
INDUSTRY OUTPUT
Value of Production – Direct $4,051,266,197
Value Added – Direct $1,453,409,572
REPRESENTATIVE
Wesley Bell
EMPLOYMENT
Direct 323
Indirect 221
Induced 310
Total Employment 855
COMPENSATION
Direct $43,517,205
Indirect $21,515,477
Induced $21,283,079
Total $86,315,761
INDUSTRY OUTPUT
Value of Production – Direct $116,446,922
Value Added – Direct $49,833,035
EMPLOYMENT
Direct 8,210
Indirect 7,732
Induced 6,100
Total Employment 22,043
COMPENSATION
Direct $538,548,239
Indirect $557,686,637
Induced $350,525,449
Total $1,446,760,325
INDUSTRY OUTPUT
Value of Production – Direct $2,845,055,615
Value Added – Direct $676,473,206
REPRESENTATIVE
Ann Wagner
EMPLOYMENT
Direct 186
Indirect 102
Induced 99
Total Employment 386
COMPENSATION
Direct $13,117,858
Indirect $9,116,864
Induced $6,438,931
Total $28,673,653
INDUSTRY OUTPUT
Value of Production – Direct $62,800,648
Value Added – Direct $16,608,913
REPRESENTATIVE
Robert Onder
EMPLOYMENT
Direct 1,012
Indirect 850
Induced 551
Total Employment 2,413
COMPENSATION
Direct $65,970,861
Indirect $63,539,766
Induced $31,343,936
Total $160,854,564
INDUSTRY OUTPUT
Value of Production – Direct $368,250,926
Value Added – Direct $82,961,679
REPRESENTATIVE
Mark Alford
EMPLOYMENT
Direct 1,222
Indirect 770
Induced 785
Total Employment 2,777
COMPENSATION
Direct $93,867,700
Indirect $55,369,445
Induced $44,234,666
Total $193,471,811
INDUSTRY OUTPUT
Value of Production – Direct $384,787,595
Value Added – Direct $113,864,977
REPRESENTATIVE
Emanuel Cleaver
EMPLOYMENT
Direct 418
Indirect 419
Induced 418
Total Employment 1,255
COMPENSATION
Direct $30,506,627
Indirect $35,520,349
Induced $27,389,893
Total $93,416,870
INDUSTRY OUTPUT
Value of Production – Direct $144,940,164
Value Added – Direct $38,573,228
REPRESENTATIVE
Sam Graves
EMPLOYMENT
Direct 766
Indirect 670
Induced 592
Total Employment 2,028
COMPENSATION
Direct $52,518,499
Indirect $51,042,226
Induced $35,586,816
Total $139,147,541
INDUSTRY OUTPUT
Value of Production – Direct $260,973,612
Value Added – Direct $63,061,876
REPRESENTATIVE
Eric Burlison
EMPLOYMENT
Direct 704
Indirect 844
Induced 657
Total Employment 2,205
COMPENSATION
Direct $34,986,282
Indirect $59,435,675
Induced $37,917,151
Total $132,339,108
INDUSTRY OUTPUT
Value of Production – Direct $217,187,047
Value Added – Direct $44,595,900
REPRESENTATIVE
Jason Smith
EMPLOYMENT
Direct 3,579
Indirect 3,857
Induced 2,688
Total Employment 10,124
COMPENSATION
Direct $204,063,206
Indirect $262,146,834
Induced $146,330,977
Total $612,541,018
INDUSTRY OUTPUT
Value of Production – Direct $1,289,668,701
Value Added – Direct $266,973,599
REPRESENTATIVE
Nathaniel Moran
EMPLOYMENT
Direct 2,111
Indirect 5,587
Induced 4,108
Total Employment 11,807
COMPENSATION
Direct $162,167,820
Indirect $385,588,705
Induced $231,897,343
Total $779,653,868
INDUSTRY OUTPUT
Value of Production – Direct $1,045,743,917
Value Added – Direct $277,382,642
EMPLOYMENT
Direct 29,362
Indirect 28,128
Induced 23,043
Total Employment 80,533
COMPENSATION
Direct $2,150,031,144
Indirect $2,112,407,572
Induced $1,371,953,398
Total $5,634,392,114
INDUSTRY OUTPUT
Value of Production – Direct $11,470,882,920
Value Added – Direct $3,322,483,512
REPRESENTATIVE
Dan Crenshaw
EMPLOYMENT
Direct 141
Indirect 96
Induced 76
Total Employment 313
COMPENSATION
Direct $12,360,259
Indirect $8,299,446
Induced $4,640,227
Total $25,299,932
INDUSTRY OUTPUT
Value of Production – Direct $60,783,304
Value Added – Direct $18,367,033
REPRESENTATIVE
Keith Self
EMPLOYMENT
Direct 701
Indirect 545
Induced 400
Total Employment 1,645
COMPENSATION
Direct $43,991,449
Indirect $43,246,623
Induced $25,014,601
Total $112,252,673
INDUSTRY OUTPUT
Value of Production – Direct $235,826,514
Value Added – Direct $64,478,673
REPRESENTATIVE
Pat Fallon
EMPLOYMENT
Direct 1,577
Indirect 1,349
Induced 1,154
Total Employment 4,080
COMPENSATION
Direct $112,986,125
Indirect $99,147,261
Induced $72,531,841
Total $284,665,227
INDUSTRY OUTPUT
Value of Production – Direct $545,456,508
Value Added – Direct $156,569,218
REPRESENTATIVE
Lance Gooden
EMPLOYMENT
Direct 690
Indirect 384
Induced 400
Total Employment 1,474
COMPENSATION
Direct $50,124,535
Indirect $29,631,241
Induced $25,235,913
Total $104,991,688
INDUSTRY OUTPUT
Value of Production – Direct $234,241,360
Value Added – Direct $75,272,770
REPRESENTATIVE
Jake Ellzey
EMPLOYMENT
Direct 1,875
Indirect 1,430
Induced 1,036
Total Employment 4,341
COMPENSATION
Direct $115,759,101
Indirect $116,647,226
Induced $66,247,319
Total $298,653,645
INDUSTRY OUTPUT
Value of Production – Direct $659,900,820
Value Added – Direct $175,284,903
REPRESENTATIVE
Lizzie Fletcher
EMPLOYMENT
Direct 142
Indirect 49
Induced 65
Total Employment 256
COMPENSATION
Direct $14,837,582
Indirect $4,648,802
Induced $4,015,928
Total $23,502,313
INDUSTRY OUTPUT
Value of Production – Direct $50,733,317
Value Added – Direct $19,862,750
REPRESENTATIVE
Morgan Luttrell
EMPLOYMENT
Direct 2,691
Indirect 1,381
Induced 1,210
Total Employment 5,282
COMPENSATION
Direct $200,370,329
Indirect $127,000,606
Induced $72,958,921
Total $400,329,856
INDUSTRY OUTPUT
Value of Production – Direct $1,420,317,069
Value Added – Direct $414,450,051
REPRESENTATIVE
Al Green
EMPLOYMENT
Direct 259
Indirect 123
Induced 149
Total Employment 531
COMPENSATION
Direct $30,957,423
Indirect $10,527,333
Induced $9,311,891
Total $50,796,647
INDUSTRY OUTPUT
Value of Production – Direct $134,680,553
Value Added – Direct $45,836,560
REPRESENTATIVE
Michael McCaul
EMPLOYMENT
Direct 570
Indirect 683
Induced 474
Total Employment 1,727
COMPENSATION
Direct $38,658,864
Indirect $54,925,915
Induced $29,439,895
Total $123,024,674
INDUSTRY OUTPUT
Value of Production – Direct $255,164,022
Value Added – Direct $65,931,595
REPRESENTATIVE
August Pfluger
EMPLOYMENT
Direct 178
Indirect 196
Induced 181
Total Employment 555
COMPENSATION
Direct $11,087,513
Indirect $15,115,727
Induced $10,794,230
Total $36,997,470
INDUSTRY OUTPUT
Value of Production – Direct $51,698,565
Value Added – Direct $14,499,483
REPRESENTATIVE
Craig Goldman
EMPLOYMENT
Direct 949
Indirect 724
Induced 528
Total Employment 2,201
COMPENSATION
Direct $71,949,344
Indirect $52,158,510
Induced $33,221,589
Total $157,329,443
INDUSTRY OUTPUT
Value of Production – Direct $367,423,204
Value Added – Direct $104,963,680
REPRESENTATIVE
Ronny Jackson
EMPLOYMENT
Direct 297
Indirect 356
Induced 360
Total Employment 1,013
COMPENSATION
Direct $19,385,254
Indirect $24,450,667
Induced $20,772,731
Total $64,608,652
INDUSTRY OUTPUT
Value of Production – Direct $83,834,251
Value Added – Direct $24,373,173
REPRESENTATIVE
Randy Weber
EMPLOYMENT
Direct 270
Indirect 248
Induced 266
Total Employment 785
COMPENSATION
Direct $22,869,629
Indirect $16,679,949
Induced $14,645,184
Total $54,194,763
INDUSTRY OUTPUT
Value of Production – Direct $91,720,433
Value Added – Direct $31,277,514
REPRESENTATIVE
Monica De La Cruz
EMPLOYMENT
Direct 519
Indirect 571
Induced 557
Total Employment 1,646
COMPENSATION
Direct $31,505,476
Indirect $32,950,972
Induced $28,768,290
Total $93,224,739
INDUSTRY OUTPUT
Value of Production – Direct $164,047,985
Value Added – Direct $43,635,217
REPRESENTATIVE
Veronica Escobar
EMPLOYMENT
Direct 259
Indirect 491
Induced 418
Total Employment 1,169
COMPENSATION
Direct $15,464,911
Indirect $30,946,277
Induced $23,005,197
Total $69,416,386
INDUSTRY OUTPUT
Value of Production – Direct $93,935,322
Value Added – Direct $23,491,950
REPRESENTATIVE
Pete Sessions
EMPLOYMENT
Direct 3,361
Indirect 5,142
Induced 3,558
Total Employment 12,061
COMPENSATION
Direct $240,384,641
Indirect $366,739,091
Induced $207,972,813
Total $815,096,546
INDUSTRY OUTPUT
Value of Production – Direct $1,461,095,997
Value Added – Direct $375,029,943
REPRESENTATIVE
Sylvester Turner
EMPLOYMENT
Direct 987
Indirect 496
Induced 443
Total Employment 1,926
COMPENSATION
Direct $91,336,549
Indirect $47,981,256
Induced $27,926,359
Total $167,244,164
INDUSTRY OUTPUT
Value of Production – Direct $347,832,639
Value Added – Direct $121,739,660
REPRESENTATIVE
Jodey Arrington
EMPLOYMENT
Direct 332
Indirect 514
Induced 488
Total Employment 1,334
COMPENSATION
Direct $16,609,897
Indirect $34,089,497
Induced $27,069,293
Total $77,768,686
INDUSTRY OUTPUT
Value of Production – Direct $90,334,000
Value Added – Direct $23,857,844
REPRESENTATIVE
Joaquin Castro
EMPLOYMENT
Direct 343
Indirect 186
Induced 236
Total Employment 765
COMPENSATION
Direct $31,906,971
Indirect $13,827,056
Induced $12,974,205
Total $58,708,232
INDUSTRY OUTPUT
Value of Production – Direct $117,910,352
Value Added – Direct $46,007,515
REPRESENTATIVE
Chip Roy
EMPLOYMENT
Direct 565
Indirect 536
Induced 393
Total Employment 1,494
COMPENSATION
Direct $41,885,484
Indirect $39,781,842
Induced $22,846,260
Total $104,513,585
INDUSTRY OUTPUT
Value of Production – Direct $212,280,777
Value Added – Direct $64,504,209
REPRESENTATIVE
Troy Nehls
EMPLOYMENT
Direct 218
Indirect 133
Induced 153
Total Employment 504
COMPENSATION
Direct $24,169,830
Indirect $9,118,384
Induced $8,205,343
Total $41,493,557
INDUSTRY OUTPUT
Value of Production – Direct $72,890,944
Value Added – Direct $29,246,996
REPRESENTATIVE
Tony Gonzales
EMPLOYMENT
Direct 274
Indirect 180
Induced 177
Total Employment 631
COMPENSATION
Direct $14,609,825
Indirect $12,801,987
Induced $10,189,968
Total $37,601,780
INDUSTRY OUTPUT
Value of Production – Direct $77,749,763
Value Added – Direct $19,983,937
REPRESENTATIVE
Beth Van Duyne
EMPLOYMENT
Direct 600
Indirect 325
Induced 324
Total Employment 1,249
COMPENSATION
Direct $48,315,290
Indirect $29,032,220
Induced $20,587,973
Total $97,935,483
INDUSTRY OUTPUT
Value of Production – Direct $222,563,787
Value Added – Direct $74,063,544
REPRESENTATIVE
Roger Williams
EMPLOYMENT
Direct 1,490
Indirect 1,037
Induced 813
Total Employment 3,340
COMPENSATION
Direct $88,747,679
Indirect $73,466,334
Induced $50,215,224
Total $212,429,236
INDUSTRY OUTPUT
Value of Production – Direct $475,193,752
Value Added – Direct $131,085,310
REPRESENTATIVE
Brandon Gill
EMPLOYMENT
Direct 246
Indirect 204
Induced 155
Total Employment 606
COMPENSATION
Direct $17,898,224
Indirect $15,288,024
Induced $9,420,417
Total $42,606,666
INDUSTRY OUTPUT
Value of Production – Direct $78,013,762
Value Added – Direct $23,437,335
REPRESENTATIVE
Michael Cloud
EMPLOYMENT
Direct 255
Indirect 362
Induced 322
Total Employment 939
COMPENSATION
Direct $14,662,132
Indirect $23,959,779
Induced $17,987,397
Total $56,609,308
INDUSTRY OUTPUT
Value of Production – Direct $87,916,748
Value Added – Direct $20,762,595
REPRESENTATIVE
Henry Cuellar
EMPLOYMENT
Direct 423
Indirect 487
Induced 317
Total Employment 1,226
COMPENSATION
Direct $27,579,446
Indirect $29,921,588
Induced $17,019,181
Total $74,520,215
INDUSTRY OUTPUT
Value of Production – Direct $144,680,471
Value Added – Direct $41,458,574
REPRESENTATIVE
Sylvia Garcia
EMPLOYMENT
Direct 659
Indirect 254
Induced 286
Total Employment 1,199
COMPENSATION
Direct $58,331,137
Indirect $22,519,076
Induced $18,001,811
Total $98,852,024
INDUSTRY OUTPUT
Value of Production – Direct $229,479,675
Value Added – Direct $78,049,269
REPRESENTATIVE
Jasmine Crockett
EMPLOYMENT
Direct 1,055
Indirect 543
Induced 523
Total Employment 2,121
COMPENSATION
Direct $74,859,888
Indirect $48,770,763
Induced $33,902,226
Total $157,532,877
INDUSTRY OUTPUT
Value of Production – Direct $319,617,207
Value Added – Direct $101,899,504
REPRESENTATIVE
John Carter
EMPLOYMENT
Direct 315
Indirect 297
Induced 300
Total Employment 913
COMPENSATION
Direct $27,875,506
Indirect $21,329,557
Induced $17,853,361
Total $67,058,424
INDUSTRY OUTPUT
Value of Production – Direct $103,514,068
Value Added – Direct $34,878,733
REPRESENTATIVE
Julie Johnson
EMPLOYMENT
Direct 591
Indirect 231
Induced 314
Total Employment 1,136
COMPENSATION
Direct $49,631,868
Indirect $22,028,599
Induced $20,124,137
Total $91,784,604
INDUSTRY OUTPUT
Value of Production – Direct $205,438,445
Value Added – Direct $77,119,676
REPRESENTATIVE
Marc Veasey
EMPLOYMENT
Direct 1,185
Indirect 611
Induced 590
Total Employment 2,385
COMPENSATION
Direct $87,921,996
Indirect $53,805,466
Induced $37,768,622
Total $179,496,084
INDUSTRY OUTPUT
Value of Production – Direct $393,858,775
Value Added – Direct $124,013,532
REPRESENTATIVE
Vicente Gonzalez
EMPLOYMENT
Direct 170
Indirect 227
Induced 205
Total Employment 602
COMPENSATION
Direct $8,110,316
Indirect $13,325,723
Induced $10,450,137
Total $31,886,176
INDUSTRY OUTPUT
Value of Production – Direct $47,470,320
Value Added – Direct $12,014,017
REPRESENTATIVE
Greg Casar
EMPLOYMENT
Direct 1,215
Indirect 795
Induced 912
Total Employment 2,922
COMPENSATION
Direct $99,017,511
Indirect $60,934,194
Induced $56,302,247
Total $216,253,952
INDUSTRY OUTPUT
Value of Production – Direct $423,986,160
Value Added – Direct $140,446,996
REPRESENTATIVE
Brian Babin
EMPLOYMENT
Direct 1,361
Indirect 1,107
Induced 901
Total Employment 3,369
COMPENSATION
Direct $88,410,306
Indirect $96,976,509
Induced $56,901,129
Total $242,287,944
INDUSTRY OUTPUT
Value of Production – Direct $696,012,368
Value Added – Direct $167,789,970
REPRESENTATIVE
Lloyd Doggett
EMPLOYMENT
Direct 117
Indirect 111
Induced 96
Total Employment 323
COMPENSATION
Direct $9,255,564
Indirect $11,211,937
Induced $6,226,502
Total $26,694,003
INDUSTRY OUTPUT
Value of Production – Direct $41,421,764
Value Added – Direct $13,911,825
REPRESENTATIVE
Wesley Hunt
EMPLOYMENT
Direct 368
Indirect 140
Induced 154
Total Employment 662
COMPENSATION
Direct $34,035,470
Indirect $13,533,429
Induced $9,507,694
Total $57,076,592
INDUSTRY OUTPUT
Value of Production – Direct $126,114,002
Value Added – Direct $45,505,319
REPRESENTATIVE
Kevin Hern
EMPLOYMENT
Direct 250
Indirect 359
Induced 186
Total Employment 795
COMPENSATION
Direct $11,127,928
Indirect $26,493,480
Induced $10,500,900
Total $48,122,308
INDUSTRY OUTPUT
Value of Production – Direct $97,408,087
Value Added – Direct $23,552,117
EMPLOYMENT
Direct 2,770
Indirect 2,940
Induced 1,938
Total Employment 7,647
COMPENSATION
Direct $148,657,885
Indirect $193,584,318
Induced $107,014,121
Total $449,256,324
INDUSTRY OUTPUT
Value of Production – Direct $1,299,291,462
Value Added – Direct $390,854,668
REPRESENTATIVE
Josh Brecheen
EMPLOYMENT
Direct 1,325
Indirect 1,681
Induced 1,155
Total Employment 4,161
COMPENSATION
Direct $81,081,092
Indirect $108,780,096
Induced $63,519,685
Total $253,380,873
INDUSTRY OUTPUT
Value of Production – Direct $800,547,508
Value Added – Direct $262,542,619
REPRESENTATIVE
Frank Lucas
EMPLOYMENT
Direct 462
Indirect 362
Induced 254
Total Employment 1,078
COMPENSATION
Direct $22,886,938
Indirect $25,347,217
Induced $14,194,158
Total $62,428,313
INDUSTRY OUTPUT
Value of Production – Direct $180,926,576
Value Added – Direct $46,679,118
REPRESENTATIVE
Tom Cole
EMPLOYMENT
Direct 426
Indirect 322
Induced 194
Total Employment 942
COMPENSATION
Direct $17,538,910
Indirect $17,793,980
Induced $10,492,466
Total $45,825,355
INDUSTRY OUTPUT
Value of Production – Direct $118,238,513
Value Added – Direct $27,000,771
REPRESENTATIVE
Stephanie Bice
EMPLOYMENT
Direct 306
Indirect 216
Induced 149
Total Employment 671
COMPENSATION
Direct $16,023,017
Indirect $15,169,544
Induced $8,306,913
Total $39,499,475
INDUSTRY OUTPUT
Value of Production – Direct $102,170,777
Value Added – Direct $31,080,043
REPRESENTATIVE
Tracey Mann
EMPLOYMENT
Direct 629
Indirect 403
Induced 344
Total Employment 1,376
COMPENSATION
Direct $37,112,825
Indirect $28,531,568
Induced $18,724,928
Total $84,369,322
INDUSTRY OUTPUT
Value of Production – Direct $218,515,703
Value Added – Direct $75,829,404
EMPLOYMENT
Direct 2,180
Indirect 1,644
Induced 1,364
Total Employment 5,188
COMPENSATION
Direct $132,824,702
Indirect $121,805,738
Induced $78,093,171
Total $332,723,611
INDUSTRY OUTPUT
Value of Production – Direct $820,707,616
Value Added – Direct $284,870,430
REPRESENTATIVE
Derek Schmidt
EMPLOYMENT
Direct 757
Indirect 525
Induced 450
Total Employment 1,732
COMPENSATION
Direct $44,118,541
Indirect $39,419,196
Induced $26,219,644
Total $109,757,382
INDUSTRY OUTPUT
Value of Production – Direct $304,704,069
Value Added – Direct $106,713,923
REPRESENTATIVE
Sharice Davids
EMPLOYMENT
Direct 240
Indirect 263
Induced 215
Total Employment 718
COMPENSATION
Direct $20,289,022
Indirect $22,275,745
Induced $13,930,448
Total $56,495,214
INDUSTRY OUTPUT
Value of Production – Direct $114,439,225
Value Added – Direct $43,681,883
REPRESENTATIVE
Ron Estes
EMPLOYMENT
Direct 554
Indirect 453
Induced 355
Total Employment 1,361
COMPENSATION
Direct $31,304,314
Indirect $31,579,229
Induced $19,218,150
Total $82,101,693
INDUSTRY OUTPUT
Value of Production – Direct $183,048,619
Value Added – Direct $58,645,221
REPRESENTATIVE
Melanie Stansbury
EMPLOYMENT
Direct 389
Indirect 341
Induced 220
Total Employment 951
COMPENSATION
Direct $20,115,188
Indirect $22,629,792
Induced $12,172,988
Total $54,917,968
INDUSTRY OUTPUT
Value of Production – Direct $109,363,529
Value Added – Direct $15,738,683
EMPLOYMENT
Direct 1,179
Indirect 905
Induced 645
Total Employment 2,729
COMPENSATION
Direct $52,787,603
Indirect $59,007,037
Induced $36,703,955
Total $148,498,595
INDUSTRY OUTPUT
Value of Production – Direct $340,195,443
Value Added – Direct $41,042,555
REPRESENTATIVE
Gabe Vasquez
EMPLOYMENT
Direct 532
Indirect 295
Induced 256
Total Employment 1,083
COMPENSATION
Direct $22,530,323
Indirect $19,338,538
Induced $14,797,065
Total $56,665,926
INDUSTRY OUTPUT
Value of Production – Direct $141,718,111
Value Added – Direct $19,542,885
REPRESENTATIVE
Teresa Leger Fernandez
EMPLOYMENT
Direct 258
Indirect 269
Induced 169
Total Employment 695
COMPENSATION
Direct $10,142,092
Indirect $17,038,707
Induced $9,733,902
Total $36,914,700
INDUSTRY OUTPUT
Value of Production – Direct $89,113,803
Value Added – Direct $5,760,987
REPRESENTATIVE
Diana DeGette
EMPLOYMENT
Direct 251
Indirect 193
Induced 183
Total Employment 627
COMPENSATION
Direct $27,246,740
Indirect $22,732,829
Induced $13,709,869
Total $63,689,438
INDUSTRY OUTPUT
Value of Production – Direct $88,743,155
Value Added – Direct $34,886,647
EMPLOYMENT
Direct 4,620
Indirect 4,261
Induced 3,519
Total Employment 12,401
COMPENSATION
Direct $349,521,650
Indirect $344,034,584
Induced $223,394,428
Total $916,950,662
INDUSTRY OUTPUT
Value of Production – Direct $1,787,759,190
Value Added – Direct $498,935,932
REPRESENTATIVE
Joe Neguse
EMPLOYMENT
Direct 727
Indirect 787
Induced 629
Total Employment 2,143
COMPENSATION
Direct $56,537,730
Indirect $73,579,439
Induced $40,682,812
Total $170,799,981
INDUSTRY OUTPUT
Value of Production – Direct $321,781,206
Value Added – Direct $85,845,759
REPRESENTATIVE
Jeff Hurd
EMPLOYMENT
Direct 1,187
Indirect 1,723
Induced 1,167
Total Employment 4,077
COMPENSATION
Direct $66,919,088
Indirect $112,932,601
Induced $69,272,665
Total $249,124,355
INDUSTRY OUTPUT
Value of Production – Direct $477,400,263
Value Added – Direct $103,296,352
REPRESENTATIVE
Lauren Boebert
EMPLOYMENT
Direct 556
Indirect 360
Induced 358
Total Employment 1,273
COMPENSATION
Direct $49,482,500
Indirect $32,290,723
Induced $23,240,223
Total $105,013,446
INDUSTRY OUTPUT
Value of Production – Direct $221,410,789
Value Added – Direct $68,045,661
REPRESENTATIVE
Jeff Crank
EMPLOYMENT
Direct 263
Indirect 265
Induced 244
Total Employment 773
COMPENSATION
Direct $17,176,003
Indirect $18,209,179
Induced $14,131,229
Total $49,516,411
INDUSTRY OUTPUT
Value of Production – Direct $87,574,234
Value Added – Direct $23,695,060
REPRESENTATIVE
Jason Crow
EMPLOYMENT
Direct 175
Indirect 84
Induced 88
Total Employment 348
COMPENSATION
Direct $15,574,313
Indirect $8,165,033
Induced $6,012,791
Total $29,752,136
INDUSTRY OUTPUT
Value of Production – Direct $54,164,885
Value Added – Direct $19,245,070
REPRESENTATIVE
Brittany Pettersen
EMPLOYMENT
Direct 272
Indirect 172
Induced 142
Total Employment 586
COMPENSATION
Direct $18,523,114
Indirect $14,429,217
Induced $9,271,921
Total $42,224,253
INDUSTRY OUTPUT
Value of Production – Direct $96,833,135
Value Added – Direct $25,493,855
REPRESENTATIVE
Gabe Evans
EMPLOYMENT
Direct 1,188
Indirect 678
Induced 708
Total Employment 2,574
COMPENSATION
Direct $98,062,162
Indirect $61,695,564
Induced $47,072,917
Total $206,830,643
INDUSTRY OUTPUT
Value of Production – Direct $439,851,524
Value Added – Direct $138,427,529
REPRESENTATIVE
David Schweikert
EMPLOYMENT
Direct 330
Indirect 193
Induced 206
Total Employment 728
COMPENSATION
Direct $30,355,807
Indirect $16,463,985
Induced $13,093,875
Total $59,913,667
INDUSTRY OUTPUT
Value of Production – Direct $110,574,495
Value Added – Direct $35,783,786
EMPLOYMENT
Direct 5,226
Indirect 4,101
Induced 4,225
Total Employment 13,552
COMPENSATION
Direct $459,545,350
Indirect $305,115,753
Induced $261,344,572
Total $1,026,005,674
INDUSTRY OUTPUT
Value of Production – Direct $1,743,427,097
Value Added – Direct $528,060,920
REPRESENTATIVE
Eli Crane
EMPLOYMENT
Direct 519
Indirect 688
Induced 606
Total Employment 1,813
COMPENSATION
Direct $35,097,649
Indirect $43,873,992
Induced $35,741,520
Total $114,713,161
INDUSTRY OUTPUT
Value of Production – Direct $188,961,485
Value Added – Direct $42,566,041
REPRESENTATIVE
Yassamin Ansari
EMPLOYMENT
Direct 1,428
Indirect 1,069
Induced 917
Total Employment 3,414
COMPENSATION
Direct $125,158,715
Indirect $86,525,165
Induced $59,061,744
Total $270,745,624
INDUSTRY OUTPUT
Value of Production – Direct $448,680,233
Value Added – Direct $141,793,452
REPRESENTATIVE
Greg Stanton
EMPLOYMENT
Direct 242
Indirect 134
Induced 149
Total Employment 526
COMPENSATION
Direct $22,750,040
Indirect $11,095,386
Induced $9,529,599
Total $43,375,024
INDUSTRY OUTPUT
Value of Production – Direct $78,184,251
Value Added – Direct $25,525,641
REPRESENTATIVE
Andy Biggs
EMPLOYMENT
Direct 225
Indirect 98
Induced 144
Total Employment 466
COMPENSATION
Direct $21,758,599
Indirect $7,895,279
Induced $9,127,528
Total $38,781,406
INDUSTRY OUTPUT
Value of Production – Direct $89,213,840
Value Added – Direct $25,575,262
REPRESENTATIVE
Juan Ciscomani
EMPLOYMENT
Direct 351
Indirect 380
Induced 362
Total Employment 1,094
COMPENSATION
Direct $24,921,288
Indirect $24,997,510
Induced $21,171,740
Total $71,090,537
INDUSTRY OUTPUT
Value of Production – Direct $111,091,463
Value Added – Direct $30,417,270
REPRESENTATIVE
Raul Grijalva
EMPLOYMENT
Direct 985
Indirect 813
Induced 958
Total Employment 2,755
COMPENSATION
Direct $91,736,947
Indirect $59,068,658
Induced $57,222,691
Total $208,028,297
INDUSTRY OUTPUT
Value of Production – Direct $319,934,031
Value Added – Direct $103,266,627
REPRESENTATIVE
Abraham Hamadeh
EMPLOYMENT
Direct 361
Indirect 155
Induced 220
Total Employment 736
COMPENSATION
Direct $32,863,763
Indirect $12,684,493
Induced $14,097,880
Total $59,646,136
INDUSTRY OUTPUT
Value of Production – Direct $125,011,788
Value Added – Direct $38,987,445
REPRESENTATIVE
Paul Gosar
EMPLOYMENT
Direct 785
Indirect 571
Induced 663
Total Employment 2,020
COMPENSATION
Direct $74,902,541
Indirect $42,511,285
Induced $42,297,996
Total $159,711,822
INDUSTRY OUTPUT
Value of Production – Direct $271,775,509
Value Added – Direct $84,145,395
REPRESENTATIVE
Blake Moore
EMPLOYMENT
Direct 875
Indirect 709
Induced 615
Total Employment 2,199
COMPENSATION
Direct $50,980,785
Indirect $51,328,523
Induced $34,293,529
Total $136,602,837
INDUSTRY OUTPUT
Value of Production – Direct $269,977,078
Value Added – Direct $78,160,073
EMPLOYMENT
Direct 3,685
Indirect 2,996
Induced 2,363
Total Employment 9,044
COMPENSATION
Direct $206,387,598
Indirect $223,312,335
Induced $135,961,785
Total $565,661,719
INDUSTRY OUTPUT
Value of Production – Direct $1,210,557,331
Value Added – Direct $326,571,055
REPRESENTATIVE
Celeste Maloy
EMPLOYMENT
Direct 1,382
Indirect 1,297
Induced 940
Total Employment 3,619
COMPENSATION
Direct $77,740,280
Indirect $98,616,988
Induced $54,533,245
Total $230,890,513
INDUSTRY OUTPUT
Value of Production – Direct $470,770,563
Value Added – Direct $124,890,969
REPRESENTATIVE
Mike Kennedy
EMPLOYMENT
Direct 838
Indirect 669
Induced 487
Total Employment 1,994
COMPENSATION
Direct $44,759,950
Indirect $48,331,712
Induced $28,564,635
Total $121,656,297
INDUSTRY OUTPUT
Value of Production – Direct $278,403,397
Value Added – Direct $69,940,653
REPRESENTATIVE
Burgess Owens
EMPLOYMENT
Direct 590
Indirect 320
Induced 321
Total Employment 1,231
COMPENSATION
Direct $32,906,583
Indirect $25,035,112
Induced $18,570,376
Total $76,512,071
INDUSTRY OUTPUT
Value of Production – Direct $191,406,293
Value Added – Direct $53,579,360
REPRESENTATIVE
Dina Titus
EMPLOYMENT
Direct 299
Indirect 159
Induced 101
Total Employment 560
COMPENSATION
Direct $19,969,324
Indirect $11,222,037
Induced $6,126,443
Total $37,317,803
INDUSTRY OUTPUT
Value of Production – Direct $102,024,129
Value Added – Direct $22,116,427
EMPLOYMENT
Direct 1,956
Indirect 1,681
Induced 1,424
Total Employment 5,061
COMPENSATION
Direct $154,488,694
Indirect $128,711,665
Induced $86,171,931
Total $369,372,291
INDUSTRY OUTPUT
Value of Production – Direct $714,707,356
Value Added – Direct $170,590,074
REPRESENTATIVE
Mark Amodei
EMPLOYMENT
Direct 1,031
Indirect 1,225
Induced 1,100
Total Employment 3,357
COMPENSATION
Direct $91,642,107
Indirect $96,318,266
Induced $66,494,323
Total $254,454,697
INDUSTRY OUTPUT
Value of Production – Direct $391,218,078
Value Added – Direct $100,976,321
REPRESENTATIVE
Susie Lee
EMPLOYMENT
Direct 175
Indirect 75
Induced 56
Total Employment 306
COMPENSATION
Direct $12,083,658
Indirect $5,422,286
Induced $3,410,796
Total $20,916,740
INDUSTRY OUTPUT
Value of Production – Direct $56,336,265
Value Added – Direct $13,495,670
REPRESENTATIVE
Steven Horsford
EMPLOYMENT
Direct 451
Indirect 221
Induced 166
Total Employment 838
COMPENSATION
Direct $30,793,606
Indirect $15,749,077
Induced $10,140,369
Total $56,683,051
INDUSTRY OUTPUT
Value of Production – Direct $165,128,884
Value Added – Direct $34,001,655
REPRESENTATIVE
Doug LaMalfa
EMPLOYMENT
Direct 3,309
Indirect 5,551
Induced 4,561
Total Employment 13,421
COMPENSATION
Direct $219,694,497
Indirect $449,915,086
Induced $297,680,959
Total $967,290,542
INDUSTRY OUTPUT
Value of Production – Direct $1,445,086,936
Value Added – Direct $459,024,266
EMPLOYMENT
Direct 29,556
Indirect 23,200
Induced 19,079
Total Employment 71,835
COMPENSATION
Direct $2,164,809,615
Indirect $2,080,389,040
Induced $1,335,335,296
Total $5,580,533,952
INDUSTRY OUTPUT
Value of Production – Direct $11,298,300,569
Value Added – Direct $3,902,446,687
REPRESENTATIVE
Jared Huffman
EMPLOYMENT
Direct 2,222
Indirect 3,091
Induced 2,132
Total Employment 7,444
COMPENSATION
Direct $181,675,685
Indirect $289,613,394
Induced $165,040,715
Total $636,329,794
INDUSTRY OUTPUT
Value of Production – Direct $1,131,009,333
Value Added – Direct $358,326,337
REPRESENTATIVE
Kevin Kiley
EMPLOYMENT
Direct 1,286
Indirect 1,642
Induced 1,273
Total Employment 4,201
COMPENSATION
Direct $105,973,724
Indirect $141,283,050
Induced $88,800,823
Total $336,057,597
INDUSTRY OUTPUT
Value of Production – Direct $598,508,772
Value Added – Direct $194,929,863
REPRESENTATIVE
Mike Thompson
EMPLOYMENT
Direct 1,290
Indirect 1,049
Induced 945
Total Employment 3,284
COMPENSATION
Direct $102,826,378
Indirect $93,107,161
Induced $68,456,951
Total $264,390,490
INDUSTRY OUTPUT
Value of Production – Direct $494,239,847
Value Added – Direct $183,289,330
REPRESENTATIVE
Tom McClintock
EMPLOYMENT
Direct 1,027
Indirect 823
Induced 679
Total Employment 2,529
COMPENSATION
Direct $73,360,803
Indirect $70,669,974
Induced $45,196,303
Total $189,227,080
INDUSTRY OUTPUT
Value of Production – Direct $474,930,582
Value Added – Direct $145,869,132
REPRESENTATIVE
Ami Bera
EMPLOYMENT
Direct 946
Indirect 671
Induced 549
Total Employment 2,166
COMPENSATION
Direct $61,588,798
Indirect $62,978,685
Induced $38,446,659
Total $163,014,143
INDUSTRY OUTPUT
Value of Production – Direct $328,953,749
Value Added – Direct $109,550,148
REPRESENTATIVE
Doris Matsui
EMPLOYMENT
Direct 950
Indirect 597
Induced 530
Total Employment 2,077
COMPENSATION
Direct $61,961,381
Indirect $54,028,780
Induced $37,091,336
Total $153,081,497
INDUSTRY OUTPUT
Value of Production – Direct $314,027,534
Value Added – Direct $110,380,262
REPRESENTATIVE
John Garamendi
EMPLOYMENT
Direct 495
Indirect 266
Induced 289
Total Employment 1,051
COMPENSATION
Direct $43,459,715
Indirect $24,405,909
Induced $21,522,833
Total $89,388,456
INDUSTRY OUTPUT
Value of Production – Direct $176,768,152
Value Added – Direct $69,678,699
REPRESENTATIVE
Josh Harder
EMPLOYMENT
Direct 1,354
Indirect 1,421
Induced 1,151
Total Employment 3,926
COMPENSATION
Direct $108,105,303
Indirect $125,913,489
Induced $76,170,914
Total $310,189,706
INDUSTRY OUTPUT
Value of Production – Direct $528,943,143
Value Added – Direct $197,824,443
REPRESENTATIVE
Mark Desaulnier
EMPLOYMENT
Direct 171
Indirect 92
Induced 83
Total Employment 347
COMPENSATION
Direct $13,014,536
Indirect $9,261,234
Induced $6,448,683
Total $28,724,453
INDUSTRY OUTPUT
Value of Production – Direct $54,958,313
Value Added – Direct $19,234,109
REPRESENTATIVE
Nancy Pelosi
EMPLOYMENT
Direct 119
Indirect 104
Induced 112
Total Employment 335
COMPENSATION
Direct $14,415,888
Indirect $19,127,032
Induced $12,196,367
Total $45,739,288
INDUSTRY OUTPUT
Value of Production – Direct $59,942,207
Value Added – Direct $26,739,361
REPRESENTATIVE
Lateefah Simon
EMPLOYMENT
Direct 286
Indirect 144
Induced 134
Total Employment 564
COMPENSATION
Direct $24,358,427
Indirect $16,165,556
Induced $10,882,949
Total $51,406,932
INDUSTRY OUTPUT
Value of Production – Direct $108,819,208
Value Added – Direct $43,486,559
REPRESENTATIVE
Adam Gray
EMPLOYMENT
Direct 963
Indirect 636
Induced 546
Total Employment 2,144
COMPENSATION
Direct $62,900,203
Indirect $55,754,460
Induced $35,894,038
Total $154,548,701
INDUSTRY OUTPUT
Value of Production – Direct $313,777,809
Value Added – Direct $101,786,329
REPRESENTATIVE
Eric Swalwell
EMPLOYMENT
Direct 517
Indirect 250
Induced 222
Total Employment 989
COMPENSATION
Direct $39,884,290
Indirect $26,965,579
Induced $17,938,390
Total $84,788,259
INDUSTRY OUTPUT
Value of Production – Direct $154,592,070
Value Added – Direct $59,049,782
REPRESENTATIVE
Kevin Mullin
EMPLOYMENT
Direct 197
Indirect 124
Induced 107
Total Employment 428
COMPENSATION
Direct $21,062,571
Indirect $19,111,345
Induced $10,759,399
Total $50,933,316
INDUSTRY OUTPUT
Value of Production – Direct $74,917,667
Value Added – Direct $34,887,908
REPRESENTATIVE
Sam Liccardo
EMPLOYMENT
Direct 104
Indirect 29
Induced 39
Total Employment 172
COMPENSATION
Direct $9,759,284
Indirect $4,194,438
Induced $3,615,229
Total $17,568,952
INDUSTRY OUTPUT
Value of Production – Direct $39,375,623
Value Added – Direct $17,192,374
REPRESENTATIVE
Ro Khanna
EMPLOYMENT
Direct 547
Indirect 208
Induced 189
Total Employment 943
COMPENSATION
Direct $42,282,238
Indirect $30,940,351
Induced $16,523,953
Total $89,746,543
INDUSTRY OUTPUT
Value of Production – Direct $166,752,500
Value Added – Direct $65,764,698
REPRESENTATIVE
Zoe Lofgren
EMPLOYMENT
Direct 326
Indirect 115
Induced 107
Total Employment 549
COMPENSATION
Direct $20,512,948
Indirect $12,924,306
Induced $8,890,961
Total $42,328,214
INDUSTRY OUTPUT
Value of Production – Direct $104,980,798
Value Added – Direct $35,337,726
REPRESENTATIVE
Jimmy Panetta
EMPLOYMENT
Direct 243
Indirect 177
Induced 138
Total Employment 558
COMPENSATION
Direct $22,968,803
Indirect $18,230,599
Induced $11,031,821
Total $52,231,223
INDUSTRY OUTPUT
Value of Production – Direct $122,350,199
Value Added – Direct $43,819,113
REPRESENTATIVE
Vince Fong
EMPLOYMENT
Direct 528
Indirect 307
Induced 238
Total Employment 1,072
COMPENSATION
Direct $30,786,408
Indirect $26,091,066
Induced $15,553,399
Total $72,430,872
INDUSTRY OUTPUT
Value of Production – Direct $179,254,082
Value Added – Direct $51,044,850
REPRESENTATIVE
Jim Costa
EMPLOYMENT
Direct 522
Indirect 315
Induced 249
Total Employment 1,085
COMPENSATION
Direct $29,571,742
Indirect $26,638,343
Induced $16,334,941
Total $72,545,026
INDUSTRY OUTPUT
Value of Production – Direct $161,560,297
Value Added – Direct $48,948,610
REPRESENTATIVE
David Valadao
EMPLOYMENT
Direct 507
Indirect 269
Induced 212
Total Employment 988
COMPENSATION
Direct $27,867,330
Indirect $23,467,208
Induced $13,843,937
Total $65,178,475
INDUSTRY OUTPUT
Value of Production – Direct $154,048,728
Value Added – Direct $44,074,143
REPRESENTATIVE
Jay Obernolte
EMPLOYMENT
Direct 343
Indirect 117
Induced 138
Total Employment 598
COMPENSATION
Direct $25,925,403
Indirect $10,374,289
Induced $9,368,441
Total $45,668,133
INDUSTRY OUTPUT
Value of Production – Direct $117,874,247
Value Added – Direct $41,890,508
REPRESENTATIVE
Salud Carbajal
EMPLOYMENT
Direct 200
Indirect 219
Induced 211
Total Employment 629
COMPENSATION
Direct $14,773,405
Indirect $20,204,347
Induced $15,343,922
Total $50,321,673
INDUSTRY OUTPUT
Value of Production – Direct $74,242,732
Value Added – Direct $24,409,221
REPRESENTATIVE
Raul Ruiz
EMPLOYMENT
Direct 514
Indirect 279
Induced 254
Total Employment 1,046
COMPENSATION
Direct $35,747,765
Indirect $23,731,411
Induced $16,764,776
Total $76,243,953
INDUSTRY OUTPUT
Value of Production – Direct $185,026,316
Value Added – Direct $60,452,233
REPRESENTATIVE
Julia Brownley
EMPLOYMENT
Direct 370
Indirect 336
Induced 310
Total Employment 1,016
COMPENSATION
Direct $31,954,914
Indirect $33,157,145
Induced $21,374,133
Total $86,486,192
INDUSTRY OUTPUT
Value of Production – Direct $129,326,780
Value Added – Direct $51,757,199
REPRESENTATIVE
George Whitesides
EMPLOYMENT
Direct 124
Indirect 35
Induced 38
Total Employment 197
COMPENSATION
Direct $8,904,664
Indirect $3,352,934
Induced $2,746,842
Total $15,004,440
INDUSTRY OUTPUT
Value of Production – Direct $61,890,392
Value Added – Direct $20,386,134
REPRESENTATIVE
Judy Chu
EMPLOYMENT
Direct 147
Indirect 29
Induced 33
Total Employment 209
COMPENSATION
Direct $10,741,668
Indirect $2,742,509
Induced $2,361,551
Total $15,845,727
INDUSTRY OUTPUT
Value of Production – Direct $47,765,358
Value Added – Direct $18,104,455
REPRESENTATIVE
Luz Rivas
EMPLOYMENT
Direct 300
Indirect 68
Induced 78
Total Employment 446
COMPENSATION
Direct $20,927,159
Indirect $6,448,831
Induced $5,658,924
Total $33,034,913
INDUSTRY OUTPUT
Value of Production – Direct $112,961,433
Value Added – Direct $40,296,262
REPRESENTATIVE
Laura Friedman
EMPLOYMENT
Direct 157
Indirect 40
Induced 39
Total Employment 236
COMPENSATION
Direct $11,183,235
Indirect $3,989,078
Induced $2,788,104
Total $17,960,417
INDUSTRY OUTPUT
Value of Production – Direct $71,088,738
Value Added – Direct $24,678,474
REPRESENTATIVE
Gilbert Ray Cisneros, Jr
EMPLOYMENT
Direct 281
Indirect 53
Induced 58
Total Employment 392
COMPENSATION
Direct $18,703,221
Indirect $5,106,341
Induced $4,213,943
Total $28,023,506
INDUSTRY OUTPUT
Value of Production – Direct $80,241,463
Value Added – Direct $29,010,922
REPRESENTATIVE
Brad Sherman
EMPLOYMENT
Direct 201
Indirect 66
Induced 64
Total Employment 331
COMPENSATION
Direct $14,486,491
Indirect $6,536,888
Induced $4,655,773
Total $25,679,152
INDUSTRY OUTPUT
Value of Production – Direct $116,036,696
Value Added – Direct $37,519,801
REPRESENTATIVE
Pete Aguilar
EMPLOYMENT
Direct 1,031
Indirect 456
Induced 419
Total Employment 1,906
COMPENSATION
Direct $70,638,307
Indirect $39,746,142
Induced $28,601,191
Total $138,985,640
INDUSTRY OUTPUT
Value of Production – Direct $326,377,710
Value Added – Direct $115,278,479
REPRESENTATIVE
Jimmy Gomez
EMPLOYMENT
Direct 173
Indirect 51
Induced 45
Total Employment 270
COMPENSATION
Direct $12,047,532
Indirect $5,072,070
Induced $3,279,206
Total $20,398,808
INDUSTRY OUTPUT
Value of Production – Direct $75,976,877
Value Added – Direct $25,070,384
REPRESENTATIVE
Norma Torres
EMPLOYMENT
Direct 1,383
Indirect 820
Induced 553
Total Employment 2,756
COMPENSATION
Direct $93,019,346
Indirect $71,711,728
Induced $38,034,489
Total $202,765,563
INDUSTRY OUTPUT
Value of Production – Direct $446,143,941
Value Added – Direct $149,627,640
REPRESENTATIVE
Ted Lieu
EMPLOYMENT
Direct 39
Indirect 8
Induced 7
Total Employment 55
COMPENSATION
Direct $2,946,476
Indirect $866,132
Induced $535,206
Total $4,347,814
INDUSTRY OUTPUT
Value of Production – Direct $12,620,450
Value Added – Direct $4,943,482
REPRESENTATIVE
Sydney Kamlager-Dove
EMPLOYMENT
Direct 175
Indirect 31
Induced 34
Total Employment 239
COMPENSATION
Direct $12,053,206
Indirect $3,056,569
Induced $2,410,553
Total $17,520,328
INDUSTRY OUTPUT
Value of Production – Direct $52,020,713
Value Added – Direct $19,679,060
REPRESENTATIVE
Linda Sánchez
EMPLOYMENT
Direct 479
Indirect 111
Induced 107
Total Employment 697
COMPENSATION
Direct $32,701,221
Indirect $10,698,439
Induced $7,746,735
Total $51,146,395
INDUSTRY OUTPUT
Value of Production – Direct $143,744,811
Value Added – Direct $53,090,878
REPRESENTATIVE
Mark Takano
EMPLOYMENT
Direct 1,117
Indirect 738
Induced 538
Total Employment 2,393
COMPENSATION
Direct $74,003,857
Indirect $61,801,697
Induced $35,421,105
Total $171,226,659
INDUSTRY OUTPUT
Value of Production – Direct $399,455,245
Value Added – Direct $131,684,801
REPRESENTATIVE
Young Kim
EMPLOYMENT
Direct 633
Indirect 227
Induced 194
Total Employment 1,054
COMPENSATION
Direct $45,639,487
Indirect $23,399,195
Induced $13,902,798
Total $82,941,480
INDUSTRY OUTPUT
Value of Production – Direct $213,456,993
Value Added – Direct $74,144,535
REPRESENTATIVE
Ken Calvert
EMPLOYMENT
Direct 1,278
Indirect 815
Induced 629
Total Employment 2,723
COMPENSATION
Direct $89,545,221
Indirect $66,047,933
Induced $41,362,630
Total $196,955,784
INDUSTRY OUTPUT
Value of Production – Direct $470,086,077
Value Added – Direct $156,704,502
REPRESENTATIVE
Robert Garcia
EMPLOYMENT
Direct 445
Indirect 128
Induced 117
Total Employment 690
COMPENSATION
Direct $31,713,175
Indirect $12,332,142
Induced $8,506,609
Total $52,551,926
INDUSTRY OUTPUT
Value of Production – Direct $170,425,850
Value Added – Direct $61,264,986
REPRESENTATIVE
Maxine Waters
EMPLOYMENT
Direct 169
Indirect 36
Induced 37
Total Employment 242
COMPENSATION
Direct $12,032,675
Indirect $3,547,888
Induced $2,699,092
Total $18,279,655
INDUSTRY OUTPUT
Value of Production – Direct $54,338,045
Value Added – Direct $20,381,911
REPRESENTATIVE
Nanette Barragan
EMPLOYMENT
Direct 322
Indirect 80
Induced 78
Total Employment 480
COMPENSATION
Direct $22,626,473
Indirect $7,809,258
Induced $5,641,533
Total $36,077,265
INDUSTRY OUTPUT
Value of Production – Direct $103,434,504
Value Added – Direct $38,645,297
REPRESENTATIVE
Derek Tran
EMPLOYMENT
Direct 298
Indirect 90
Induced 83
Total Employment 471
COMPENSATION
Direct $22,673,969
Indirect $9,311,174
Induced $6,031,544
Total $38,016,687
INDUSTRY OUTPUT
Value of Production – Direct $97,945,925
Value Added – Direct $39,521,306
REPRESENTATIVE
Lou Correa
EMPLOYMENT
Direct 436
Indirect 140
Induced 125
Total Employment 701
COMPENSATION
Direct $32,902,771
Indirect $14,580,211
Induced $9,076,501
Total $56,559,483
INDUSTRY OUTPUT
Value of Production – Direct $144,043,548
Value Added – Direct $57,319,599
REPRESENTATIVE
Dave Min
EMPLOYMENT
Direct 115
Indirect 43
Induced 32
Total Employment 191
COMPENSATION
Direct $9,152,614
Indirect $4,842,795
Induced $2,330,840
Total $16,326,249
INDUSTRY OUTPUT
Value of Production – Direct $38,723,091
Value Added – Direct $16,412,570
REPRESENTATIVE
Darrell Issa
EMPLOYMENT
Direct 319
Indirect 95
Induced 137
Total Employment 551
COMPENSATION
Direct $31,259,010
Indirect $8,381,151
Induced $9,406,072
Total $49,046,234
INDUSTRY OUTPUT
Value of Production – Direct $129,167,177
Value Added – Direct $59,396,876
REPRESENTATIVE
Mike Levin
EMPLOYMENT
Direct 238
Indirect 69
Induced 95
Total Employment 402
COMPENSATION
Direct $23,288,975
Indirect $6,813,604
Induced $6,715,751
Total $36,818,330
INDUSTRY OUTPUT
Value of Production – Direct $95,858,209
Value Added – Direct $45,069,332
REPRESENTATIVE
Scott Peters
EMPLOYMENT
Direct 81
Indirect 34
Induced 29
Total Employment 144
COMPENSATION
Direct $6,685,487
Indirect $3,401,610
Induced $2,038,548
Total $12,125,645
INDUSTRY OUTPUT
Value of Production – Direct $29,349,674
Value Added – Direct $11,145,318
REPRESENTATIVE
Sara Jacobs
EMPLOYMENT
Direct 234
Indirect 93
Induced 99
Total Employment 426
COMPENSATION
Direct $25,024,798
Indirect $9,436,135
Induced $6,971,458
Total $41,432,391
INDUSTRY OUTPUT
Value of Production – Direct $96,371,104
Value Added – Direct $48,441,930
REPRESENTATIVE
Juan Vargas
EMPLOYMENT
Direct 46
Indirect 12
Induced 14
Total Employment 72
COMPENSATION
Direct $3,476,138
Indirect $1,102,347
Induced $1,025,466
Total $5,603,951
INDUSTRY OUTPUT
Value of Production – Direct $14,508,923
Value Added – Direct $5,880,547
REPRESENTATIVE
Chellie Pingree
EMPLOYMENT
Direct 946
Indirect 1,302
Induced 897
Total Employment 3,145
COMPENSATION
Direct $74,215,878
Indirect $88,482,871
Induced $58,234,974
Total $220,933,723
INDUSTRY OUTPUT
Value of Production – Direct $391,009,490
Value Added – Direct $113,107,892
EMPLOYMENT
Direct 5,226
Indirect 7,008
Induced 4,728
Total Employment 16,963
COMPENSATION
Direct $400,675,607
Indirect $433,335,162
Induced $287,748,232
Total $1,121,759,000
INDUSTRY OUTPUT
Value of Production – Direct $2,338,370,689
Value Added – Direct $645,226,633
REPRESENTATIVE
Jared Golden
EMPLOYMENT
Direct 4,280
Indirect 5,706
Induced 3,832
Total Employment 13,818
COMPENSATION
Direct $326,459,729
Indirect $344,852,290
Induced $229,513,258
Total $900,825,277
INDUSTRY OUTPUT
Value of Production – Direct $1,947,361,199
Value Added – Direct $532,118,742
REPRESENTATIVE
Chris Pappas
EMPLOYMENT
Direct 485
Indirect 499
Induced 379
Total Employment 1,364
COMPENSATION
Direct $36,247,088
Indirect $42,083,709
Induced $25,683,091
Total $104,013,888
INDUSTRY OUTPUT
Value of Production – Direct $181,826,844
Value Added – Direct $58,888,491
EMPLOYMENT
Direct 1,936
Indirect 2,096
Induced 1,565
Total Employment 5,597
COMPENSATION
Direct $144,359,099
Indirect $166,813,543
Induced $105,494,205
Total $416,666,847
INDUSTRY OUTPUT
Value of Production – Direct $830,641,741
Value Added – Direct $246,412,417
REPRESENTATIVE
Maggie Goodlander
EMPLOYMENT
Direct 1,451
Indirect 1,597
Induced 1,186
Total Employment 4,234
COMPENSATION
Direct $108,112,011
Indirect $124,729,835
Induced $79,811,113
Total $312,652,959
INDUSTRY OUTPUT
Value of Production – Direct $648,814,897
Value Added – Direct $187,523,926
REPRESENTATIVE
Becca Balint
EMPLOYMENT
Direct 1,767
Indirect 2,057
Induced 1,257
Total Employment 5,081
COMPENSATION
Direct $101,190,586
Indirect $120,286,542
Induced $77,573,711
Total $299,050,839
INDUSTRY OUTPUT
Value of Production – Direct $664,663,344
Value Added – Direct $152,224,184
EMPLOYMENT
Direct 1,767
Indirect 2,057
Induced 1,257
Total Employment 5,081
COMPENSATION
Direct $101,190,586
Indirect $120,286,542
Induced $77,573,711
Total $299,050,839
INDUSTRY OUTPUT
Value of Production – Direct $664,663,344
Value Added – Direct $152,224,184
REPRESENTATIVE
Richard Neal
EMPLOYMENT
Direct 464
Indirect 480
Induced 511
Total Employment 1,455
COMPENSATION
Direct $38,248,154
Indirect $38,152,659
Induced $35,310,052
Total $111,710,864
INDUSTRY OUTPUT
Value of Production – Direct $145,965,021
Value Added – Direct $30,776,616
EMPLOYMENT
Direct 3,268
Indirect 2,180
Induced 2,578
Total Employment 8,026
COMPENSATION
Direct $335,937,382
Indirect $191,735,986
Induced $190,087,439
Total $717,760,808
INDUSTRY OUTPUT
Value of Production – Direct $989,823,595
Value Added – Direct $286,358,108
REPRESENTATIVE
Jim McGovern
EMPLOYMENT
Direct 849
Indirect 654
Induced 742
Total Employment 2,245
COMPENSATION
Direct $78,159,107
Indirect $55,984,651
Induced $52,971,178
Total $187,114,936
INDUSTRY OUTPUT
Value of Production – Direct $250,540,923
Value Added – Direct $66,025,921
REPRESENTATIVE
Lori Trahan
EMPLOYMENT
Direct 291
Indirect 106
Induced 188
Total Employment 585
COMPENSATION
Direct $33,378,883
Indirect $9,607,937
Induced $14,376,558
Total $57,363,378
INDUSTRY OUTPUT
Value of Production – Direct $85,713,105
Value Added – Direct $28,177,274
REPRESENTATIVE
Jake Auchincloss
EMPLOYMENT
Direct 814
Indirect 488
Induced 562
Total Employment 1,865
COMPENSATION
Direct $96,433,644
Indirect $45,267,533
Induced $43,080,436
Total $184,781,614
INDUSTRY OUTPUT
Value of Production – Direct $257,041,607
Value Added – Direct $85,540,054
REPRESENTATIVE
Katherine Clark
EMPLOYMENT
Direct 73
Indirect 26
Induced 45
Total Employment 144
COMPENSATION
Direct $8,882,503
Indirect $2,563,197
Induced $3,544,101
Total $14,989,802
INDUSTRY OUTPUT
Value of Production – Direct $21,834,416
Value Added – Direct $7,437,653
REPRESENTATIVE
Seth Moulton
EMPLOYMENT
Direct 323
Indirect 180
Induced 238
Total Employment 742
COMPENSATION
Direct $35,612,434
Indirect $16,757,435
Induced $18,043,607
Total $70,413,475
INDUSTRY OUTPUT
Value of Production – Direct $94,863,146
Value Added – Direct $29,614,806
REPRESENTATIVE
Ayanna Pressley
EMPLOYMENT
Direct 144
Indirect 62
Induced 84
Total Employment 290
COMPENSATION
Direct $14,258,097
Indirect $6,586,783
Induced $6,754,092
Total $27,598,972
INDUSTRY OUTPUT
Value of Production – Direct $42,114,121
Value Added – Direct $11,710,774
REPRESENTATIVE
Stephen Lynch
EMPLOYMENT
Direct 103
Indirect 52
Induced 70
Total Employment 226
COMPENSATION
Direct $14,508,734
Indirect $5,827,159
Induced $6,066,920
Total $26,402,812
INDUSTRY OUTPUT
Value of Production – Direct $34,483,971
Value Added – Direct $12,999,915
REPRESENTATIVE
Bill Keating
EMPLOYMENT
Direct 206
Indirect 131
Induced 137
Total Employment 473
COMPENSATION
Direct $16,455,826
Indirect $10,988,633
Induced $9,940,495
Total $37,384,955
INDUSTRY OUTPUT
Value of Production – Direct $57,267,285
Value Added – Direct $14,075,095
REPRESENTATIVE
Gabe Amo
EMPLOYMENT
Direct 198
Indirect 113
Induced 114
Total Employment 425
COMPENSATION
Direct $10,790,456
Indirect $8,656,001
Induced $7,241,881
Total $26,688,338
INDUSTRY OUTPUT
Value of Production – Direct $50,852,123
Value Added – Direct $10,262,305
EMPLOYMENT
Direct 564
Indirect 481
Induced 364
Total Employment 1,408
COMPENSATION
Direct $28,872,625
Indirect $36,112,383
Induced $23,158,084
Total $88,143,093
INDUSTRY OUTPUT
Value of Production – Direct $179,225,527
Value Added – Direct $26,933,044
REPRESENTATIVE
Seth Magaziner
EMPLOYMENT
Direct 365
Indirect 368
Induced 250
Total Employment 983
COMPENSATION
Direct $18,082,169
Indirect $27,456,382
Induced $15,916,204
Total $61,454,755
INDUSTRY OUTPUT
Value of Production – Direct $128,373,404
Value Added – Direct $16,670,740
REPRESENTATIVE
John Larson
EMPLOYMENT
Direct 262
Indirect 225
Induced 148
Total Employment 635
COMPENSATION
Direct $14,301,070
Indirect $19,002,271
Induced $10,364,052
Total $43,667,393
INDUSTRY OUTPUT
Value of Production – Direct $69,103,137
Value Added – Direct $15,745,907
EMPLOYMENT
Direct 1,483
Indirect 1,099
Induced 864
Total Employment 3,447
COMPENSATION
Direct $90,054,241
Indirect $92,141,473
Induced $60,082,977
Total $242,278,691
INDUSTRY OUTPUT
Value of Production – Direct $438,562,693
Value Added – Direct $99,601,653
REPRESENTATIVE
Joe Courtney
EMPLOYMENT
Direct 555
Indirect 463
Induced 371
Total Employment 1,389
COMPENSATION
Direct $33,262,016
Indirect $35,842,095
Induced $24,616,430
Total $93,720,541
INDUSTRY OUTPUT
Value of Production – Direct $179,507,252
Value Added – Direct $37,028,079
REPRESENTATIVE
Rosa DeLauro
EMPLOYMENT
Direct 278
Indirect 203
Induced 144
Total Employment 626
COMPENSATION
Direct $16,955,559
Indirect $17,349,183
Induced $10,228,502
Total $44,533,243
INDUSTRY OUTPUT
Value of Production – Direct $79,141,550
Value Added – Direct $18,721,613
REPRESENTATIVE
Jim Himes
EMPLOYMENT
Direct 194
Indirect 123
Induced 107
Total Employment 424
COMPENSATION
Direct $13,665,883
Indirect $13,089,269
Induced $8,110,821
Total $34,865,973
INDUSTRY OUTPUT
Value of Production – Direct $54,126,376
Value Added – Direct $14,898,958
REPRESENTATIVE
Jahana Hayes
EMPLOYMENT
Direct 194
Indirect 85
Induced 94
Total Employment 373
COMPENSATION
Direct $11,869,713
Indirect $6,858,656
Induced $6,763,172
Total $25,491,541
INDUSTRY OUTPUT
Value of Production – Direct $56,684,377
Value Added – Direct $13,207,096
REPRESENTATIVE
Nick LaLota
EMPLOYMENT
Direct 368
Indirect 193
Induced 199
Total Employment 759
COMPENSATION
Direct $38,787,710
Indirect $18,904,154
Induced $15,361,649
Total $73,053,512
INDUSTRY OUTPUT
Value of Production – Direct $114,172,320
Value Added – Direct $35,860,779
EMPLOYMENT
Direct 9,526
Indirect 8,101
Induced 6,974
Total Employment 24,601
COMPENSATION
Direct $807,346,808
Indirect $676,189,616
Induced $505,296,649
Total $1,988,833,072
INDUSTRY OUTPUT
Value of Production – Direct $3,261,852,323
Value Added – Direct $726,273,560
REPRESENTATIVE
Andrew Garbarino
EMPLOYMENT
Direct 591
Indirect 272
Induced 286
Total Employment 1,149
COMPENSATION
Direct $59,635,326
Indirect $26,218,108
Induced $22,177,406
Total $108,030,840
INDUSTRY OUTPUT
Value of Production – Direct $178,282,632
Value Added – Direct $55,246,412
REPRESENTATIVE
Thomas Suozzi
EMPLOYMENT
Direct 52
Indirect 32
Induced 24
Total Employment 108
COMPENSATION
Direct $4,702,849
Indirect $3,000,440
Induced $1,881,219
Total $9,584,507
INDUSTRY OUTPUT
Value of Production – Direct $17,109,453
Value Added – Direct $4,239,179
REPRESENTATIVE
Laura Gillen
EMPLOYMENT
Direct 90
Indirect 49
Induced 56
Total Employment 195
COMPENSATION
Direct $12,423,493
Indirect $4,473,338
Induced $4,277,783
Total $21,174,613
INDUSTRY OUTPUT
Value of Production – Direct $34,179,852
Value Added – Direct $10,831,431
REPRESENTATIVE
Gregory Meeks
EMPLOYMENT
Direct 24
Indirect 7
Induced 8
Total Employment 39
COMPENSATION
Direct $2,161,448
Indirect $569,739
Induced $642,602
Total $3,373,789
INDUSTRY OUTPUT
Value of Production – Direct $6,632,480
Value Added – Direct $2,042,415
REPRESENTATIVE
Grace Meng
EMPLOYMENT
Direct 33
Indirect 10
Induced 12
Total Employment 55
COMPENSATION
Direct $2,978,414
Indirect $824,466
Induced $914,913
Total $4,717,793
INDUSTRY OUTPUT
Value of Production – Direct $9,764,852
Value Added – Direct $2,806,606
REPRESENTATIVE
Nydia Velázquez
EMPLOYMENT
Direct 224
Indirect 80
Induced 79
Total Employment 383
COMPENSATION
Direct $15,500,385
Indirect $6,484,006
Induced $6,078,810
Total $28,063,200
INDUSTRY OUTPUT
Value of Production – Direct $57,761,379
Value Added – Direct $14,402,225
REPRESENTATIVE
Hakeem Jeffries
EMPLOYMENT
Direct 122
Indirect 34
Induced 41
Total Employment 197
COMPENSATION
Direct $6,671,415
Indirect $2,743,675
Induced $3,186,073
Total $12,601,164
INDUSTRY OUTPUT
Value of Production – Direct $30,536,010
Value Added – Direct $6,104,366
REPRESENTATIVE
Yvette Clarke
EMPLOYMENT
Direct 78
Indirect 21
Induced 26
Total Employment 125
COMPENSATION
Direct $4,284,796
Indirect $1,660,228
Induced $2,024,398
Total $7,969,422
INDUSTRY OUTPUT
Value of Production – Direct $19,606,640
Value Added – Direct $3,897,258
REPRESENTATIVE
Dan Goldman
EMPLOYMENT
Direct 66
Indirect 18
Induced 32
Total Employment 116
COMPENSATION
Direct $5,871,575
Indirect $1,957,957
Induced $2,673,123
Total $10,502,655
INDUSTRY OUTPUT
Value of Production – Direct $18,798,675
Value Added – Direct $5,443,175
REPRESENTATIVE
Nicole Malliotakis
EMPLOYMENT
Direct 48
Indirect 28
Induced 17
Total Employment 94
COMPENSATION
Direct $1,813,928
Indirect $2,066,044
Induced $1,329,475
Total $5,209,447
INDUSTRY OUTPUT
Value of Production – Direct $11,523,893
Value Added – Direct $1,650,580
REPRESENTATIVE
Jerry Nadler
EMPLOYMENT
Direct 13
Indirect 6
Induced 21
Total Employment 40
COMPENSATION
Direct $7,044,528
Indirect $866,380
Induced $2,153,459
Total $10,064,368
INDUSTRY OUTPUT
Value of Production – Direct $9,437,913
Value Added – Direct $6,890,061
REPRESENTATIVE
Adriano Espaillat
EMPLOYMENT
Direct 18
Indirect 4
Induced 11
Total Employment 33
COMPENSATION
Direct $3,656,517
Indirect $391,018
Induced $910,134
Total $4,957,670
INDUSTRY OUTPUT
Value of Production – Direct $7,242,861
Value Added – Direct $3,516,572
REPRESENTATIVE
Alexandria Ocasio-Cortez
EMPLOYMENT
Direct 67
Indirect 21
Induced 25
Total Employment 112
COMPENSATION
Direct $4,764,960
Indirect $1,760,985
Induced $1,934,057
Total $8,460,002
INDUSTRY OUTPUT
Value of Production – Direct $18,224,352
Value Added – Direct $4,213,927
REPRESENTATIVE
Ritchie Torres
EMPLOYMENT
Direct 202
Indirect 72
Induced 78
Total Employment 351
COMPENSATION
Direct $13,144,721
Indirect $5,702,946
Induced $6,226,461
Total $25,074,128
INDUSTRY OUTPUT
Value of Production – Direct $52,980,307
Value Added – Direct $12,298,727
REPRESENTATIVE
George Latimer
EMPLOYMENT
Direct 64
Indirect 34
Induced 41
Total Employment 139
COMPENSATION
Direct $6,762,746
Indirect $3,577,831
Induced $3,307,493
Total $13,648,069
INDUSTRY OUTPUT
Value of Production – Direct $19,590,834
Value Added – Direct $6,409,029
REPRESENTATIVE
Mike Lawler
EMPLOYMENT
Direct 291
Indirect 269
Induced 222
Total Employment 782
COMPENSATION
Direct $24,298,053
Indirect $26,663,006
Induced $17,471,257
Total $68,432,316
INDUSTRY OUTPUT
Value of Production – Direct $108,072,036
Value Added – Direct $21,500,285
REPRESENTATIVE
Pat Ryan
EMPLOYMENT
Direct 498
Indirect 470
Induced 465
Total Employment 1,433
COMPENSATION
Direct $50,431,086
Indirect $37,941,402
Induced $32,622,220
Total $120,994,708
INDUSTRY OUTPUT
Value of Production – Direct $167,220,096
Value Added – Direct $46,978,425
REPRESENTATIVE
Josh Riley
EMPLOYMENT
Direct 1,651
Indirect 1,915
Induced 1,286
Total Employment 4,852
COMPENSATION
Direct $114,076,969
Indirect $145,367,200
Induced $90,795,971
Total $350,240,139
INDUSTRY OUTPUT
Value of Production – Direct $649,569,380
Value Added – Direct $96,138,364
REPRESENTATIVE
Paul Tonko
EMPLOYMENT
Direct 537
Indirect 628
Induced 520
Total Employment 1,684
COMPENSATION
Direct $39,376,618
Indirect $60,105,893
Induced $39,425,984
Total $138,908,495
INDUSTRY OUTPUT
Value of Production – Direct $188,939,713
Value Added – Direct $31,453,001
REPRESENTATIVE
Elise Stefanik
EMPLOYMENT
Direct 1,280
Indirect 1,112
Induced 949
Total Employment 3,340
COMPENSATION
Direct $100,364,484
Indirect $87,355,147
Induced $66,918,161
Total $254,637,792
INDUSTRY OUTPUT
Value of Production – Direct $441,042,214
Value Added – Direct $89,313,809
REPRESENTATIVE
Joh Mannion
EMPLOYMENT
Direct 855
Indirect 947
Induced 700
Total Employment 2,502
COMPENSATION
Direct $64,569,938
Indirect $78,929,509
Induced $49,271,068
Total $192,770,515
INDUSTRY OUTPUT
Value of Production – Direct $266,276,575
Value Added – Direct $58,473,830
REPRESENTATIVE
Nick Langworthy
EMPLOYMENT
Direct 951
Indirect 798
Induced 621
Total Employment 2,370
COMPENSATION
Direct $68,683,584
Indirect $66,412,830
Induced $44,790,918
Total $179,887,333
INDUSTRY OUTPUT
Value of Production – Direct $329,086,687
Value Added – Direct $60,541,146
REPRESENTATIVE
Claudia Tenney
EMPLOYMENT
Direct 866
Indirect 610
Induced 610
Total Employment 2,086
COMPENSATION
Direct $77,014,386
Indirect $50,197,611
Induced $42,396,451
Total $169,608,448
INDUSTRY OUTPUT
Value of Production – Direct $312,260,043
Value Added – Direct $70,120,829
REPRESENTATIVE
Joseph Morelle
EMPLOYMENT
Direct 288
Indirect 289
Induced 300
Total Employment 878
COMPENSATION
Direct $27,286,797
Indirect $26,202,017
Induced $21,780,241
Total $75,269,055
INDUSTRY OUTPUT
Value of Production – Direct $92,047,353
Value Added – Direct $25,881,736
REPRESENTATIVE
Timothy Kennedy
EMPLOYMENT
Direct 251
Indirect 182
Induced 346
Total Employment 779
COMPENSATION
Direct $51,040,083
Indirect $15,813,683
Induced $24,745,325
Total $91,599,091
INDUSTRY OUTPUT
Value of Production – Direct $101,493,773
Value Added – Direct $50,019,393
REPRESENTATIVE
Brian Fitzpatrick
EMPLOYMENT
Direct 654
Indirect 520
Induced 479
Total Employment 1,653
COMPENSATION
Direct $51,107,591
Indirect $51,630,087
Induced $33,304,837
Total $136,042,515
INDUSTRY OUTPUT
Value of Production – Direct $228,132,108
Value Added – Direct $68,692,897
EMPLOYMENT
Direct 25,676
Indirect 21,158
Induced 20,138
Total Employment 66,971
COMPENSATION
Direct $1,926,215,238
Indirect $1,751,621,467
Induced $1,282,266,145
Total $4,960,102,849
INDUSTRY OUTPUT
Value of Production – Direct $9,433,790,531
Value Added – Direct $2,555,325,207
REPRESENTATIVE
Brendan Boyle
EMPLOYMENT
Direct 64
Indirect 28
Induced 88
Total Employment 180
COMPENSATION
Direct $22,608,639
Indirect $2,561,639
Induced $6,470,114
Total $31,640,393
INDUSTRY OUTPUT
Value of Production – Direct $37,661,043
Value Added – Direct $24,030,883
REPRESENTATIVE
Dwight Evans
EMPLOYMENT
Direct 19
Indirect 6
Induced 24
Total Employment 49
COMPENSATION
Direct $5,573,925
Indirect $677,907
Induced $1,974,873
Total $8,226,705
INDUSTRY OUTPUT
Value of Production – Direct $9,507,076
Value Added – Direct $5,900,510
REPRESENTATIVE
Madeleine Dean
EMPLOYMENT
Direct 444
Indirect 231
Induced 254
Total Employment 928
COMPENSATION
Direct $31,989,947
Indirect $24,319,470
Induced $18,045,681
Total $74,355,098
INDUSTRY OUTPUT
Value of Production – Direct $137,667,564
Value Added – Direct $41,551,038
REPRESENTATIVE
Mary Gay Scanlon
EMPLOYMENT
Direct 160
Indirect 84
Induced 345
Total Employment 589
COMPENSATION
Direct $73,962,685
Indirect $8,460,164
Induced $24,343,563
Total $106,766,413
INDUSTRY OUTPUT
Value of Production – Direct $112,446,212
Value Added – Direct $78,530,398
REPRESENTATIVE
Chrissy Houlahan
EMPLOYMENT
Direct 460
Indirect 278
Induced 322
Total Employment 1,060
COMPENSATION
Direct $47,903,286
Indirect $30,044,357
Induced $23,438,322
Total $101,385,966
INDUSTRY OUTPUT
Value of Production – Direct $163,714,179
Value Added – Direct $58,815,038
REPRESENTATIVE
Ryan Mackenzie
EMPLOYMENT
Direct 843
Indirect 748
Induced 1,027
Total Employment 2,618
COMPENSATION
Direct $97,351,731
Indirect $69,739,947
Induced $68,833,376
Total $235,925,054
INDUSTRY OUTPUT
Value of Production – Direct $315,848,846
Value Added – Direct $119,795,533
REPRESENTATIVE
Robert Bresnahan
EMPLOYMENT
Direct 734
Indirect 744
Induced 636
Total Employment 2,115
COMPENSATION
Direct $46,568,206
Indirect $55,210,937
Induced $38,342,120
Total $140,121,263
INDUSTRY OUTPUT
Value of Production – Direct $238,363,808
Value Added – Direct $63,186,880
REPRESENTATIVE
Dan Meuser
EMPLOYMENT
Direct 4,252
Indirect 3,483
Induced 3,061
Total Employment 10,796
COMPENSATION
Direct $284,083,071
Indirect $291,522,642
Induced $194,919,850
Total $770,525,562
INDUSTRY OUTPUT
Value of Production – Direct $1,641,477,263
Value Added – Direct $402,852,851
REPRESENTATIVE
Scott Perry
EMPLOYMENT
Direct 487
Indirect 396
Induced 540
Total Employment 1,422
COMPENSATION
Direct $55,155,122
Indirect $35,811,896
Induced $35,895,741
Total $126,862,758
INDUSTRY OUTPUT
Value of Production – Direct $173,369,012
Value Added – Direct $65,038,067
REPRESENTATIVE
Lloyd Smucker
EMPLOYMENT
Direct 4,035
Indirect 3,340
Induced 3,360
Total Employment 10,734
COMPENSATION
Direct $350,777,898
Indirect $273,899,835
Induced $221,872,906
Total $846,550,639
INDUSTRY OUTPUT
Value of Production – Direct $1,414,968,685
Value Added – Direct $443,112,149
REPRESENTATIVE
Summer Lee
EMPLOYMENT
Direct 277
Indirect 161
Induced 164
Total Employment 602
COMPENSATION
Direct $20,500,531
Indirect $16,753,375
Induced $11,294,343
Total $48,548,250
INDUSTRY OUTPUT
Value of Production – Direct $113,628,220
Value Added – Direct $29,455,003
REPRESENTATIVE
John Joyce
EMPLOYMENT
Direct 3,849
Indirect 3,176
Induced 2,796
Total Employment 9,822
COMPENSATION
Direct $243,594,161
Indirect $250,157,123
Induced $172,021,080
Total $665,772,364
INDUSTRY OUTPUT
Value of Production – Direct $1,315,567,951
Value Added – Direct $318,465,676
REPRESENTATIVE
Guy Reschenthaler
EMPLOYMENT
Direct 1,169
Indirect 1,064
Induced 752
Total Employment 2,985
COMPENSATION
Direct $66,051,922
Indirect $92,468,306
Induced $48,837,023
Total $207,357,251
INDUSTRY OUTPUT
Value of Production – Direct $467,088,669
Value Added – Direct $95,356,354
REPRESENTATIVE
Glenn Thompson
EMPLOYMENT
Direct 6,363
Indirect 5,421
Induced 4,904
Total Employment 16,688
COMPENSATION
Direct $416,003,605
Indirect $425,280,814
Induced $295,650,389
Total $1,136,934,807
INDUSTRY OUTPUT
Value of Production – Direct $2,452,106,162
Value Added – Direct $594,556,867
REPRESENTATIVE
Mike Kelly
EMPLOYMENT
Direct 1,589
Indirect 1,327
Induced 1,246
Total Employment 4,161
COMPENSATION
Direct $94,268,216
Indirect $107,593,261
Induced $77,379,848
Total $279,241,325
INDUSTRY OUTPUT
Value of Production – Direct $525,204,123
Value Added – Direct $122,160,399
REPRESENTATIVE
Chris Deluzio
EMPLOYMENT
Direct 277
Indirect 150
Induced 141
Total Employment 568
COMPENSATION
Direct $18,714,701
Indirect $15,489,705
Induced $9,642,080
Total $43,846,486
INDUSTRY OUTPUT
Value of Production – Direct $87,039,609
Value Added – Direct $23,824,665
REPRESENTATIVE
Greg Landsman
EMPLOYMENT
Direct 465
Indirect 360
Induced 471
Total Employment 1,295
COMPENSATION
Direct $45,028,163
Indirect $34,672,497
Induced $30,413,750
Total $110,114,409
INDUSTRY OUTPUT
Value of Production – Direct $155,593,040
Value Added – Direct $57,652,451
EMPLOYMENT
Direct 16,698
Indirect 13,316
Induced 12,886
Total Employment 42,900
COMPENSATION
Direct $1,230,482,100
Indirect $1,075,922,718
Induced $742,683,941
Total $3,049,088,759
INDUSTRY OUTPUT
Value of Production – Direct $5,589,555,499
Value Added – Direct $1,646,690,586
REPRESENTATIVE
David Taylor
EMPLOYMENT
Direct 1,785
Indirect 1,540
Induced 1,343
Total Employment 4,668
COMPENSATION
Direct $112,257,041
Indirect $135,425,320
Induced $79,232,470
Total $326,914,832
INDUSTRY OUTPUT
Value of Production – Direct $611,136,332
Value Added – Direct $151,767,451
REPRESENTATIVE
Joyce Beatty
EMPLOYMENT
Direct 223
Indirect 107
Induced 159
Total Employment 489
COMPENSATION
Direct $22,857,313
Indirect $9,980,917
Induced $9,471,449
Total $42,309,680
INDUSTRY OUTPUT
Value of Production – Direct $72,403,094
Value Added – Direct $27,992,789
REPRESENTATIVE
Jim Jordan
EMPLOYMENT
Direct 1,322
Indirect 923
Induced 809
Total Employment 3,054
COMPENSATION
Direct $84,757,826
Indirect $75,008,219
Induced $45,814,726
Total $205,580,772
INDUSTRY OUTPUT
Value of Production – Direct $405,810,663
Value Added – Direct $113,152,304
REPRESENTATIVE
Bob Latta
EMPLOYMENT
Direct 1,453
Indirect 1,100
Induced 1,039
Total Employment 3,592
COMPENSATION
Direct $87,758,940
Indirect $85,704,842
Induced $57,454,254
Total $230,918,036
INDUSTRY OUTPUT
Value of Production – Direct $467,471,290
Value Added – Direct $124,446,058
REPRESENTATIVE
Michael Rulli
EMPLOYMENT
Direct 1,646
Indirect 1,559
Induced 1,408
Total Employment 4,612
COMPENSATION
Direct $97,063,627
Indirect $116,772,763
Induced $80,056,891
Total $293,893,280
INDUSTRY OUTPUT
Value of Production – Direct $582,678,941
Value Added – Direct $144,965,998
REPRESENTATIVE
Max Miller
EMPLOYMENT
Direct 1,884
Indirect 1,279
Induced 1,275
Total Employment 4,439
COMPENSATION
Direct $154,187,030
Indirect $108,640,482
Induced $75,259,095
Total $338,086,608
INDUSTRY OUTPUT
Value of Production – Direct $650,877,887
Value Added – Direct $203,734,302
REPRESENTATIVE
Warren Davidson
EMPLOYMENT
Direct 937
Indirect 685
Induced 772
Total Employment 2,394
COMPENSATION
Direct $77,798,048
Indirect $59,728,574
Induced $48,596,288
Total $186,122,910
INDUSTRY OUTPUT
Value of Production – Direct $290,923,877
Value Added – Direct $99,300,828
REPRESENTATIVE
Marcy Kaptur
EMPLOYMENT
Direct 687
Indirect 657
Induced 715
Total Employment 2,059
COMPENSATION
Direct $45,104,800
Indirect $50,390,509
Induced $41,773,226
Total $137,268,535
INDUSTRY OUTPUT
Value of Production – Direct $221,838,881
Value Added – Direct $59,799,528
REPRESENTATIVE
Mike Turner
EMPLOYMENT
Direct 328
Indirect 286
Induced 273
Total Employment 887
COMPENSATION
Direct $22,511,059
Indirect $23,633,594
Induced $16,733,443
Total $62,878,096
INDUSTRY OUTPUT
Value of Production – Direct $101,016,467
Value Added – Direct $30,143,946
REPRESENTATIVE
Shontel Brown
EMPLOYMENT
Direct 294
Indirect 180
Induced 211
Total Employment 685
COMPENSATION
Direct $26,840,095
Indirect $15,277,906
Induced $12,477,470
Total $54,595,471
INDUSTRY OUTPUT
Value of Production – Direct $91,142,046
Value Added – Direct $33,690,064
REPRESENTATIVE
Troy Balderson
EMPLOYMENT
Direct 2,849
Indirect 2,399
Induced 2,150
Total Employment 7,397
COMPENSATION
Direct $236,800,544
Indirect $186,797,918
Induced $120,182,432
Total $543,780,895
INDUSTRY OUTPUT
Value of Production – Direct $1,051,315,190
Value Added – Direct $315,325,232
REPRESENTATIVE
Emilia Sykes
EMPLOYMENT
Direct 491
Indirect 512
Induced 450
Total Employment 1,453
COMPENSATION
Direct $37,139,682
Indirect $39,470,541
Induced $25,657,886
Total $102,268,110
INDUSTRY OUTPUT
Value of Production – Direct $171,408,883
Value Added – Direct $51,328,132
REPRESENTATIVE
David Joyce
EMPLOYMENT
Direct 1,510
Indirect 1,314
Induced 1,355
Total Employment 4,179
COMPENSATION
Direct $116,609,609
Indirect $98,867,230
Induced $72,463,187
Total $287,940,026
INDUSTRY OUTPUT
Value of Production – Direct $471,811,851
Value Added – Direct $151,431,701
REPRESENTATIVE
Mike Carey
EMPLOYMENT
Direct 823
Indirect 417
Induced 457
Total Employment 1,698
COMPENSATION
Direct $63,768,322
Indirect $35,551,408
Induced $27,097,370
Total $126,417,100
INDUSTRY OUTPUT
Value of Production – Direct $244,127,056
Value Added – Direct $81,959,801
REPRESENTATIVE
Frank Mrvan
EMPLOYMENT
Direct 358
Indirect 242
Induced 260
Total Employment 861
COMPENSATION
Direct $23,668,383
Indirect $18,037,699
Induced $14,995,065
Total $56,701,147
INDUSTRY OUTPUT
Value of Production – Direct $106,297,311
Value Added – Direct $30,845,782
EMPLOYMENT
Direct 16,658
Indirect 12,292
Induced 12,040
Total Employment 40,991
COMPENSATION
Direct $1,290,593,412
Indirect $928,356,247
Induced $711,789,397
Total $2,930,739,056
INDUSTRY OUTPUT
Value of Production – Direct $5,831,293,279
Value Added – Direct $1,743,654,870
REPRESENTATIVE
Rudy Yakym
EMPLOYMENT
Direct 5,376
Indirect 4,122
Induced 4,296
Total Employment 13,794
COMPENSATION
Direct $428,171,095
Indirect $312,708,067
Induced $255,822,202
Total $996,701,364
INDUSTRY OUTPUT
Value of Production – Direct $1,805,274,251
Value Added – Direct $556,321,630
REPRESENTATIVE
Marlin Stutzman
EMPLOYMENT
Direct 2,661
Indirect 2,339
Induced 2,406
Total Employment 7,407
COMPENSATION
Direct $228,796,331
Indirect $171,727,487
Induced $141,945,052
Total $542,468,870
INDUSTRY OUTPUT
Value of Production – Direct $945,758,502
Value Added – Direct $289,326,603
REPRESENTATIVE
Jim Baird
EMPLOYMENT
Direct 1,058
Indirect 727
Induced 598
Total Employment 2,383
COMPENSATION
Direct $83,047,575
Indirect $54,903,987
Induced $34,655,726
Total $172,607,288
INDUSTRY OUTPUT
Value of Production – Direct $372,322,505
Value Added – Direct $113,199,316
REPRESENTATIVE
Victoria Spartz
EMPLOYMENT
Direct 232
Indirect 148
Induced 180
Total Employment 560
COMPENSATION
Direct $30,083,775
Indirect $13,368,058
Induced $11,559,394
Total $55,011,227
INDUSTRY OUTPUT
Value of Production – Direct $88,101,309
Value Added – Direct $35,037,903
REPRESENTATIVE
Jefferson Shreve
EMPLOYMENT
Direct 1,067
Indirect 542
Induced 488
Total Employment 2,098
COMPENSATION
Direct $77,515,346
Indirect $44,392,118
Induced $30,970,108
Total $152,877,572
INDUSTRY OUTPUT
Value of Production – Direct $386,828,791
Value Added – Direct $112,764,605
REPRESENTATIVE
André Carson
EMPLOYMENT
Direct 663
Indirect 317
Induced 301
Total Employment 1,282
COMPENSATION
Direct $53,363,960
Indirect $29,501,542
Induced $20,138,867
Total $103,004,368
INDUSTRY OUTPUT
Value of Production – Direct $200,062,487
Value Added – Direct $71,490,317
REPRESENTATIVE
Mark Messmer
EMPLOYMENT
Direct 2,080
Indirect 1,848
Induced 1,683
Total Employment 5,611
COMPENSATION
Direct $158,912,342
Indirect $136,367,989
Induced $97,481,580
Total $392,761,911
INDUSTRY OUTPUT
Value of Production – Direct $833,515,597
Value Added – Direct $221,335,600
REPRESENTATIVE
Erin Houchin
EMPLOYMENT
Direct 3,163
Indirect 2,005
Induced 1,828
Total Employment 6,996
COMPENSATION
Direct $207,034,606
Indirect $147,349,300
Induced $104,221,404
Total $458,605,309
INDUSTRY OUTPUT
Value of Production – Direct $1,093,132,526
Value Added – Direct $313,333,114
REPRESENTATIVE
Jack Bergman
EMPLOYMENT
Direct 4,083
Indirect 6,156
Induced 4,821
Total Employment 15,060
COMPENSATION
Direct $281,198,884
Indirect $428,229,265
Induced $276,820,624
Total $986,248,774
INDUSTRY OUTPUT
Value of Production – Direct $2,258,395,842
Value Added – Direct $623,908,147
EMPLOYMENT
Direct 12,328
Indirect 13,255
Induced 10,968
Total Employment 36,551
COMPENSATION
Direct $977,640,250
Indirect $944,306,489
Induced $647,801,367
Total $2,569,748,106
INDUSTRY OUTPUT
Value of Production – Direct $5,612,794,901
Value Added – Direct $1,725,972,684
REPRESENTATIVE
John Moolenaar
EMPLOYMENT
Direct 1,767
Indirect 1,527
Induced 1,290
Total Employment 4,585
COMPENSATION
Direct $137,403,672
Indirect $104,924,298
Induced $75,369,067
Total $317,697,037
INDUSTRY OUTPUT
Value of Production – Direct $781,670,196
Value Added – Direct $217,722,928
REPRESENTATIVE
Hillary Scholten
EMPLOYMENT
Direct 1,453
Indirect 1,374
Induced 1,355
Total Employment 4,181
COMPENSATION
Direct $140,903,710
Indirect $102,940,568
Induced $82,658,082
Total $326,502,360
INDUSTRY OUTPUT
Value of Production – Direct $557,849,925
Value Added – Direct $218,410,046
REPRESENTATIVE
Bill Huizenga
EMPLOYMENT
Direct 696
Indirect 540
Induced 497
Total Employment 1,733
COMPENSATION
Direct $52,673,950
Indirect $39,453,461
Induced $30,354,024
Total $122,481,435
INDUSTRY OUTPUT
Value of Production – Direct $262,091,438
Value Added – Direct $87,042,955
REPRESENTATIVE
Tim Walberg
EMPLOYMENT
Direct 1,791
Indirect 1,581
Induced 1,238
Total Employment 4,610
COMPENSATION
Direct $118,392,567
Indirect $116,473,933
Induced $75,696,698
Total $310,563,198
INDUSTRY OUTPUT
Value of Production – Direct $742,918,406
Value Added – Direct $220,187,103
REPRESENTATIVE
Debbie Dingell
EMPLOYMENT
Direct 305
Indirect 183
Induced 206
Total Employment 694
COMPENSATION
Direct $40,518,941
Indirect $15,129,803
Induced $12,794,141
Total $68,442,885
INDUSTRY OUTPUT
Value of Production – Direct $123,321,298
Value Added – Direct $52,816,347
REPRESENTATIVE
Tom Barrett
EMPLOYMENT
Direct 467
Indirect 607
Induced 378
Total Employment 1,452
COMPENSATION
Direct $36,694,027
Indirect $43,498,653
Induced $22,571,272
Total $102,763,952
INDUSTRY OUTPUT
Value of Production – Direct $217,863,398
Value Added – Direct $63,871,480
REPRESENTATIVE
Kristen McDonald Rivet
EMPLOYMENT
Direct 485
Indirect 499
Induced 423
Total Employment 1,407
COMPENSATION
Direct $42,309,843
Indirect $33,790,885
Induced $24,400,829
Total $100,501,558
INDUSTRY OUTPUT
Value of Production – Direct $203,427,722
Value Added – Direct $66,853,512
REPRESENTATIVE
Lisa McClain
EMPLOYMENT
Direct 401
Indirect 236
Induced 212
Total Employment 849
COMPENSATION
Direct $32,437,285
Indirect $17,014,740
Induced $12,846,640
Total $62,298,664
INDUSTRY OUTPUT
Value of Production – Direct $146,989,934
Value Added – Direct $47,015,721
REPRESENTATIVE
John James
EMPLOYMENT
Direct 329
Indirect 271
Induced 202
Total Employment 802
COMPENSATION
Direct $29,277,268
Indirect $19,083,347
Induced $12,168,827
Total $60,529,442
INDUSTRY OUTPUT
Value of Production – Direct $109,236,589
Value Added – Direct $41,775,744
REPRESENTATIVE
Haley Stevens
EMPLOYMENT
Direct 192
Indirect 136
Induced 136
Total Employment 464
COMPENSATION
Direct $22,053,946
Indirect $11,757,370
Induced $8,695,381
Total $42,506,697
INDUSTRY OUTPUT
Value of Production – Direct $74,167,956
Value Added – Direct $29,645,849
REPRESENTATIVE
Rashida Tlaib
EMPLOYMENT
Direct 220
Indirect 72
Induced 110
Total Employment 402
COMPENSATION
Direct $24,807,216
Indirect $5,915,775
Induced $7,000,446
Total $37,723,438
INDUSTRY OUTPUT
Value of Production – Direct $77,462,484
Value Added – Direct $31,942,790
REPRESENTATIVE
Shri Thanedar
EMPLOYMENT
Direct 138
Indirect 74
Induced 101
Total Employment 313
COMPENSATION
Direct $18,968,941
Indirect $6,094,390
Induced $6,425,336
Total $31,488,667
INDUSTRY OUTPUT
Value of Production – Direct $57,399,713
Value Added – Direct $24,780,061
REPRESENTATIVE
Jonathan Jackson
EMPLOYMENT
Direct 242
Indirect 91
Induced 100
Total Employment 433
COMPENSATION
Direct $17,754,128
Indirect $7,827,948
Induced $6,770,954
Total $32,353,030
INDUSTRY OUTPUT
Value of Production – Direct $71,060,635
Value Added – Direct $21,944,075
EMPLOYMENT
Direct 8,299
Indirect 6,333
Induced 6,234
Total Employment 20,867
COMPENSATION
Direct $637,951,481
Indirect $513,399,532
Induced $393,214,817
Total $1,544,565,830
INDUSTRY OUTPUT
Value of Production – Direct $2,742,399,263
Value Added – Direct $820,988,336
REPRESENTATIVE
Robin Kelly
EMPLOYMENT
Direct 632
Indirect 271
Induced 249
Total Employment 1,151
COMPENSATION
Direct $38,025,385
Indirect $22,978,924
Induced $16,955,936
Total $77,960,244
INDUSTRY OUTPUT
Value of Production – Direct $170,819,953
Value Added – Direct $47,708,472
REPRESENTATIVE
Delia Ramirez
EMPLOYMENT
Direct 277
Indirect 104
Induced 131
Total Employment 512
COMPENSATION
Direct $36,168,785
Indirect $9,830,761
Induced $9,034,438
Total $55,033,984
INDUSTRY OUTPUT
Value of Production – Direct $105,061,367
Value Added – Direct $44,126,058
REPRESENTATIVE
Jesus Garcia
EMPLOYMENT
Direct 418
Indirect 134
Induced 175
Total Employment 727
COMPENSATION
Direct $37,970,694
Indirect $11,931,209
Induced $12,139,045
Total $62,040,947
INDUSTRY OUTPUT
Value of Production – Direct $124,637,683
Value Added – Direct $46,621,064
REPRESENTATIVE
Mike Quigley
EMPLOYMENT
Direct 107
Indirect 30
Induced 50
Total Employment 187
COMPENSATION
Direct $12,459,085
Indirect $2,864,659
Induced $3,453,246
Total $18,776,989
INDUSTRY OUTPUT
Value of Production – Direct $40,663,684
Value Added – Direct $15,900,842
REPRESENTATIVE
Sean Casten
EMPLOYMENT
Direct 158
Indirect 60
Induced 69
Total Employment 287
COMPENSATION
Direct $15,644,098
Indirect $5,723,998
Induced $4,716,638
Total $26,084,735
INDUSTRY OUTPUT
Value of Production – Direct $53,002,438
Value Added – Direct $20,060,717
REPRESENTATIVE
Danny Davis
EMPLOYMENT
Direct 402
Indirect 163
Induced 174
Total Employment 739
COMPENSATION
Direct $38,502,722
Indirect $17,306,673
Induced $12,251,423
Total $68,060,818
INDUSTRY OUTPUT
Value of Production – Direct $120,442,659
Value Added – Direct $46,792,332
REPRESENTATIVE
Raja Krishnamoorthi
EMPLOYMENT
Direct 504
Indirect 243
Induced 247
Total Employment 994
COMPENSATION
Direct $55,197,080
Indirect $23,184,759
Induced $16,820,558
Total $95,202,396
INDUSTRY OUTPUT
Value of Production – Direct $185,874,739
Value Added – Direct $70,459,527
REPRESENTATIVE
Jan Schakowsky
EMPLOYMENT
Direct 80
Indirect 19
Induced 37
Total Employment 137
COMPENSATION
Direct $9,743,934
Indirect $1,777,874
Induced $2,577,119
Total $14,098,927
INDUSTRY OUTPUT
Value of Production – Direct $28,512,972
Value Added – Direct $11,971,417
REPRESENTATIVE
Brad Schneider
EMPLOYMENT
Direct 213
Indirect 158
Induced 186
Total Employment 557
COMPENSATION
Direct $24,330,828
Indirect $16,752,905
Induced $12,623,804
Total $53,707,538
INDUSTRY OUTPUT
Value of Production – Direct $76,468,911
Value Added – Direct $29,266,285
REPRESENTATIVE
Bill Foster
EMPLOYMENT
Direct 418
Indirect 193
Induced 169
Total Employment 780
COMPENSATION
Direct $28,223,756
Indirect $16,741,157
Induced $11,130,122
Total $56,095,036
INDUSTRY OUTPUT
Value of Production – Direct $120,247,435
Value Added – Direct $35,785,628
REPRESENTATIVE
Mike Bost
EMPLOYMENT
Direct 820
Indirect 1,169
Induced 1,085
Total Employment 3,073
COMPENSATION
Direct $56,364,177
Indirect $83,140,363
Induced $64,171,105
Total $203,675,644
INDUSTRY OUTPUT
Value of Production – Direct $298,189,371
Value Added – Direct $72,566,400
REPRESENTATIVE
Nikki Budzinski
EMPLOYMENT
Direct 504
Indirect 521
Induced 519
Total Employment 1,544
COMPENSATION
Direct $35,252,000
Indirect $40,566,469
Induced $31,768,415
Total $107,586,885
INDUSTRY OUTPUT
Value of Production – Direct $191,025,405
Value Added – Direct $48,267,487
REPRESENTATIVE
Lauren Underwood
EMPLOYMENT
Direct 424
Indirect 284
Induced 224
Total Employment 932
COMPENSATION
Direct $30,422,725
Indirect $22,889,535
Induced $13,939,877
Total $67,252,136
INDUSTRY OUTPUT
Value of Production – Direct $141,702,122
Value Added – Direct $40,937,250
REPRESENTATIVE
Mary Miller
EMPLOYMENT
Direct 1,543
Indirect 1,634
Induced 1,567
Total Employment 4,744
COMPENSATION
Direct $103,105,957
Indirect $127,905,613
Induced $96,870,746
Total $327,882,316
INDUSTRY OUTPUT
Value of Production – Direct $544,391,387
Value Added – Direct $139,131,315
REPRESENTATIVE
Darin LaHood
EMPLOYMENT
Direct 1,032
Indirect 836
Induced 763
Total Employment 2,631
COMPENSATION
Direct $65,214,663
Indirect $66,614,487
Induced $46,747,825
Total $178,576,975
INDUSTRY OUTPUT
Value of Production – Direct $314,626,947
Value Added – Direct $85,947,771
REPRESENTATIVE
Eric Sorensen
EMPLOYMENT
Direct 524
Indirect 423
Induced 492
Total Employment 1,438
COMPENSATION
Direct $33,571,463
Indirect $35,362,199
Induced $31,243,568
Total $100,177,230
INDUSTRY OUTPUT
Value of Production – Direct $155,671,556
Value Added – Direct $43,501,697
REPRESENTATIVE
Bryan Steil
EMPLOYMENT
Direct 636
Indirect 392
Induced 334
Total Employment 1,363
COMPENSATION
Direct $45,149,152
Indirect $28,832,751
Induced $20,685,447
Total $94,667,350
INDUSTRY OUTPUT
Value of Production – Direct $182,767,456
Value Added – Direct $57,502,854
EMPLOYMENT
Direct 18,595
Indirect 15,883
Induced 13,289
Total Employment 47,767
COMPENSATION
Direct $1,234,540,906
Indirect $1,185,008,906
Induced $786,936,950
Total $3,206,486,762
INDUSTRY OUTPUT
Value of Production – Direct $6,611,321,839
Value Added – Direct $1,793,239,966
REPRESENTATIVE
Mark Pocan
EMPLOYMENT
Direct 739
Indirect 689
Induced 534
Total Employment 1,962
COMPENSATION
Direct $50,346,384
Indirect $55,733,918
Induced $34,521,289
Total $140,601,591
INDUSTRY OUTPUT
Value of Production – Direct $244,946,737
Value Added – Direct $71,441,038
REPRESENTATIVE
Derrick Van Orden
EMPLOYMENT
Direct 2,754
Indirect 2,902
Induced 2,203
Total Employment 7,859
COMPENSATION
Direct $184,759,915
Indirect $210,447,088
Induced $128,243,966
Total $523,450,968
INDUSTRY OUTPUT
Value of Production – Direct $1,053,223,675
Value Added – Direct $271,780,553
REPRESENTATIVE
Gwen Moore
EMPLOYMENT
Direct 243
Indirect 101
Induced 130
Total Employment 475
COMPENSATION
Direct $21,068,883
Indirect $7,586,128
Induced $8,140,300
Total $36,795,311
INDUSTRY OUTPUT
Value of Production – Direct $70,605,527
Value Added – Direct $26,390,934
REPRESENTATIVE
Scott Fitzgerald
EMPLOYMENT
Direct 778
Indirect 576
Induced 461
Total Employment 1,815
COMPENSATION
Direct $58,532,061
Indirect $48,007,843
Induced $28,717,009
Total $135,256,913
INDUSTRY OUTPUT
Value of Production – Direct $322,606,034
Value Added – Direct $89,621,675
REPRESENTATIVE
Glenn Grothman
EMPLOYMENT
Direct 1,543
Indirect 950
Induced 881
Total Employment 3,374
COMPENSATION
Direct $104,897,518
Indirect $73,587,491
Induced $52,673,801
Total $231,158,810
INDUSTRY OUTPUT
Value of Production – Direct $533,709,375
Value Added – Direct $149,447,090
REPRESENTATIVE
Tom Tiffany
EMPLOYMENT
Direct 9,342
Indirect 7,975
Induced 6,814
Total Employment 24,132
COMPENSATION
Direct $603,132,659
Indirect $581,903,834
Induced $397,410,692
Total $1,582,447,184
INDUSTRY OUTPUT
Value of Production – Direct $3,364,752,611
Value Added – Direct $896,939,520
REPRESENTATIVE
Tony Wied
EMPLOYMENT
Direct 2,559
Indirect 2,297
Induced 1,931
Total Employment 6,787
COMPENSATION
Direct $166,654,334
Indirect $178,909,853
Induced $116,544,448
Total $462,108,636
INDUSTRY OUTPUT
Value of Production – Direct $838,710,424
Value Added – Direct $230,116,302
REPRESENTATIVE
Mariannette Miller-Meeks
EMPLOYMENT
Direct 4,399
Indirect 2,483
Induced 3,274
Total Employment 10,156
COMPENSATION
Direct $469,114,837
Indirect $179,212,261
Induced $180,695,539
Total $829,022,638
INDUSTRY OUTPUT
Value of Production – Direct $1,481,643,675
Value Added – Direct $565,808,610
EMPLOYMENT
Direct 10,850
Indirect 7,007
Induced 7,597
Total Employment 25,455
COMPENSATION
Direct $982,361,661
Indirect $512,803,288
Induced $419,616,010
Total $1,914,780,959
INDUSTRY OUTPUT
Value of Production – Direct $3,533,050,499
Value Added – Direct $1,188,536,867
REPRESENTATIVE
Ashley Hinson
EMPLOYMENT
Direct 2,744
Indirect 1,978
Induced 1,929
Total Employment 6,650
COMPENSATION
Direct $232,326,412
Indirect $144,244,976
Induced $105,047,309
Total $481,618,696
INDUSTRY OUTPUT
Value of Production – Direct $918,862,722
Value Added – Direct $282,254,060
REPRESENTATIVE
Zach Nunn
EMPLOYMENT
Direct 1,031
Indirect 788
Induced 635
Total Employment 2,454
COMPENSATION
Direct $72,697,831
Indirect $63,402,614
Induced $36,906,442
Total $173,006,888
INDUSTRY OUTPUT
Value of Production – Direct $312,564,402
Value Added – Direct $88,885,280
REPRESENTATIVE
Randy Feenstra
EMPLOYMENT
Direct 2,677
Indirect 1,759
Induced 1,759
Total Employment 6,195
COMPENSATION
Direct $208,222,581
Indirect $125,943,437
Induced $96,966,719
Total $431,132,737
INDUSTRY OUTPUT
Value of Production – Direct $819,979,699
Value Added – Direct $251,588,918
REPRESENTATIVE
Brad Finstad
EMPLOYMENT
Direct 1,255
Indirect 900
Induced 1,142
Total Employment 3,298
COMPENSATION
Direct $107,922,141
Indirect $68,845,140
Induced $70,894,866
Total $247,662,147
INDUSTRY OUTPUT
Value of Production – Direct $421,047,508
Value Added – Direct $144,811,292
EMPLOYMENT
Direct 14,356
Indirect 10,875
Induced 11,898
Total Employment 37,129
COMPENSATION
Direct $1,313,468,240
Indirect $896,626,730
Induced $760,369,406
Total $2,970,464,376
INDUSTRY OUTPUT
Value of Production – Direct $5,414,915,839
Value Added – Direct $2,013,983,380
REPRESENTATIVE
Angie Craig
EMPLOYMENT
Direct 1,802
Indirect 1,556
Induced 1,609
Total Employment 4,967
COMPENSATION
Direct $210,872,120
Indirect $127,861,806
Induced $102,802,196
Total $441,536,122
INDUSTRY OUTPUT
Value of Production – Direct $667,419,811
Value Added – Direct $285,191,007
REPRESENTATIVE
Kelly Morrison
EMPLOYMENT
Direct 317
Indirect 156
Induced 162
Total Employment 634
COMPENSATION
Direct $27,054,925
Indirect $16,445,529
Induced $11,259,426
Total $54,759,880
INDUSTRY OUTPUT
Value of Production – Direct $109,728,823
Value Added – Direct $39,870,290
REPRESENTATIVE
Betty McCollum
EMPLOYMENT
Direct 4,575
Indirect 3,460
Induced 3,742
Total Employment 11,778
COMPENSATION
Direct $420,508,787
Indirect $300,441,600
Induced $253,818,780
Total $974,769,166
INDUSTRY OUTPUT
Value of Production – Direct $1,563,420,924
Value Added – Direct $619,501,271
REPRESENTATIVE
Ilhan Omar
EMPLOYMENT
Direct 274
Indirect 113
Induced 155
Total Employment 542
COMPENSATION
Direct $28,420,998
Indirect $11,267,648
Induced $10,903,261
Total $50,591,908
INDUSTRY OUTPUT
Value of Production – Direct $104,952,796
Value Added – Direct $44,685,803
REPRESENTATIVE
Tom Emmer
EMPLOYMENT
Direct 1,263
Indirect 741
Induced 758
Total Employment 2,761
COMPENSATION
Direct $102,687,480
Indirect $62,080,829
Induced $48,030,672
Total $212,798,981
INDUSTRY OUTPUT
Value of Production – Direct $451,122,435
Value Added – Direct $157,001,013
REPRESENTATIVE
Michelle Fischbach
EMPLOYMENT
Direct 3,241
Indirect 2,303
Induced 2,615
Total Employment 8,159
COMPENSATION
Direct $271,751,654
Indirect $180,806,956
Induced $154,673,393
Total $607,232,002
INDUSTRY OUTPUT
Value of Production – Direct $1,147,758,554
Value Added – Direct $404,811,343
REPRESENTATIVE
Pete Stauber
EMPLOYMENT
Direct 1,627
Indirect 1,647
Induced 1,716
Total Employment 4,990
COMPENSATION
Direct $144,250,134
Indirect $128,877,221
Induced $107,986,813
Total $381,114,169
INDUSTRY OUTPUT
Value of Production – Direct $949,464,989
Value Added – Direct $318,111,361
REPRESENTATIVE
Mike Flood
EMPLOYMENT
Direct 507
Indirect 384
Induced 307
Total Employment 1,199
COMPENSATION
Direct $29,216,664
Indirect $30,746,106
Induced $17,612,181
Total $77,574,951
INDUSTRY OUTPUT
Value of Production – Direct $194,918,642
Value Added – Direct $59,192,982
EMPLOYMENT
Direct 2,543
Indirect 1,897
Induced 1,597
Total Employment 6,037
COMPENSATION
Direct $154,702,987
Indirect $145,673,464
Induced $91,436,613
Total $391,813,064
INDUSTRY OUTPUT
Value of Production – Direct $935,181,484
Value Added – Direct $290,651,507
REPRESENTATIVE
Don Bacon
EMPLOYMENT
Direct 369
Indirect 287
Induced 259
Total Employment 915
COMPENSATION
Direct $23,844,296
Indirect $27,361,790
Induced $16,304,467
Total $67,510,553
INDUSTRY OUTPUT
Value of Production – Direct $131,903,891
Value Added – Direct $43,028,146
REPRESENTATIVE
Adrian Smith
EMPLOYMENT
Direct 1,667
Indirect 1,226
Induced 1,031
Total Employment 3,923
COMPENSATION
Direct $101,642,027
Indirect $87,565,568
Induced $57,519,965
Total $246,727,560
INDUSTRY OUTPUT
Value of Production – Direct $608,358,951
Value Added – Direct $188,430,379
REPRESENTATIVE
Dusty Johnson
EMPLOYMENT
Direct 2,267
Indirect 1,870
Induced 1,644
Total Employment 5,780
COMPENSATION
Direct $159,052,478
Indirect $145,431,790
Induced $96,020,570
Total $400,504,838
INDUSTRY OUTPUT
Value of Production – Direct $934,965,748
Value Added – Direct $266,505,242
EMPLOYMENT
Direct 2,267
Indirect 1,870
Induced 1,644
Total Employment 5,780
COMPENSATION
Direct $159,052,478
Indirect $145,431,790
Induced $96,020,570
Total $400,504,838
INDUSTRY OUTPUT
Value of Production – Direct $934,965,748
Value Added – Direct $266,505,242
REPRESENTATIVE
Julie Fedorchak
EMPLOYMENT
Direct 2,725
Indirect 1,726
Induced 1,776
Total Employment 6,227
COMPENSATION
Direct $206,820,936
Indirect $134,153,792
Induced $107,490,185
Total $448,464,913
INDUSTRY OUTPUT
Value of Production – Direct $898,076,279
Value Added – Direct $284,385,667
EMPLOYMENT
Direct 2,725
Indirect 1,726
Induced 1,776
Total Employment 6,227
COMPENSATION
Direct $206,820,936
Indirect $134,153,792
Induced $107,490,185
Total $448,464,913
INDUSTRY OUTPUT
Value of Production – Direct $898,076,279
Value Added – Direct $284,385,667
REPRESENTATIVE
Harriet Hageman
EMPLOYMENT
Direct 658
Indirect 673
Induced 461
Total Employment 1,793
COMPENSATION
Direct $41,195,673
Indirect $52,914,708
Induced $24,772,939
Total $118,883,319
INDUSTRY OUTPUT
Value of Production – Direct $266,438,728
Value Added – Direct $50,157,140
EMPLOYMENT
Direct 658
Indirect 673
Induced 461
Total Employment 1,793
COMPENSATION
Direct $41,195,673
Indirect $52,914,708
Induced $24,772,939
Total $118,883,319
INDUSTRY OUTPUT
Value of Production – Direct $266,438,728
Value Added – Direct $50,157,140
REPRESENTATIVE
Russ Fulcher
EMPLOYMENT
Direct 5,834
Indirect 5,530
Induced 4,840
Total Employment 16,204
COMPENSATION
Direct $550,092,372
Indirect $433,960,029
Induced $278,245,859
Total $1,262,298,260
INDUSTRY OUTPUT
Value of Production – Direct $2,546,749,139
Value Added – Direct $822,901,381
EMPLOYMENT
Direct 7,246
Indirect 6,780
Induced 6,152
Total Employment 20,178
COMPENSATION
Direct $703,773,254
Indirect $540,947,934
Induced $356,335,418
Total $1,601,056,606
INDUSTRY OUTPUT
Value of Production – Direct $3,128,483,518
Value Added – Direct $1,030,798,578
REPRESENTATIVE
Mike Simpson
EMPLOYMENT
Direct 1,413
Indirect 1,249
Induced 1,312
Total Employment 3,974
COMPENSATION
Direct $153,680,882
Indirect $106,987,905
Induced $78,089,559
Total $338,758,346
INDUSTRY OUTPUT
Value of Production – Direct $581,734,380
Value Added – Direct $207,897,196
REPRESENTATIVE
Suzanne Bonamici
EMPLOYMENT
Direct 1,464
Indirect 1,295
Induced 947
Total Employment 3,706
COMPENSATION
Direct $127,347,765
Indirect $133,563,602
Induced $67,012,470
Total $327,923,837
INDUSTRY OUTPUT
Value of Production – Direct $776,291,147
Value Added – Direct $270,517,197
EMPLOYMENT
Direct 23,844
Indirect 22,531
Induced 19,913
Total Employment 66,288
COMPENSATION
Direct $2,229,792,700
Indirect $1,791,922,401
Induced $1,280,175,323
Total $5,301,890,424
INDUSTRY OUTPUT
Value of Production – Direct $11,917,269,759
Value Added – Direct $4,585,190,402
REPRESENTATIVE
Cliff Bentz
EMPLOYMENT
Direct 8,529
Indirect 8,067
Induced 6,942
Total Employment 23,538
COMPENSATION
Direct $662,554,582
Indirect $638,283,702
Induced $442,143,873
Total $1,742,982,157
INDUSTRY OUTPUT
Value of Production – Direct $4,130,518,687
Value Added – Direct $1,542,777,468
REPRESENTATIVE
Maxine Dexter
EMPLOYMENT
Direct 635
Indirect 404
Induced 431
Total Employment 1,470
COMPENSATION
Direct $70,298,947
Indirect $36,952,434
Induced $30,589,905
Total $137,841,287
INDUSTRY OUTPUT
Value of Production – Direct $296,579,824
Value Added – Direct $125,230,062
REPRESENTATIVE
Val Hoyle
EMPLOYMENT
Direct 7,344
Indirect 8,681
Induced 8,291
Total Employment 24,316
COMPENSATION
Direct $814,553,702
Indirect $643,388,066
Induced $516,901,586
Total $1,974,843,354
INDUSTRY OUTPUT
Value of Production – Direct $3,988,227,394
Value Added – Direct $1,574,932,335
REPRESENTATIVE
Janelle Bynum
EMPLOYMENT
Direct 3,626
Indirect 2,621
Induced 2,177
Total Employment 8,424
COMPENSATION
Direct $364,347,364
Indirect $215,808,829
Induced $146,535,452
Total $726,691,645
INDUSTRY OUTPUT
Value of Production – Direct $1,712,173,474
Value Added – Direct $686,702,520
REPRESENTATIVE
Andrea Salinas
EMPLOYMENT
Direct 2,246
Indirect 1,463
Induced 1,124
Total Employment 4,833
COMPENSATION
Direct $190,690,340
Indirect $123,925,767
Induced $76,992,036
Total $391,608,144
INDUSTRY OUTPUT
Value of Production – Direct $1,013,479,233
Value Added – Direct $385,030,820
REPRESENTATIVE
Suzan DelBene
EMPLOYMENT
Direct 451
Indirect 143
Induced 107
Total Employment 702
COMPENSATION
Direct $38,671,782
Indirect $16,684,265
Induced $8,647,961
Total $64,004,008
INDUSTRY OUTPUT
Value of Production – Direct $214,870,237
Value Added – Direct $93,569,746
EMPLOYMENT
Direct 14,515
Indirect 14,858
Induced 10,122
Total Employment 39,495
COMPENSATION
Direct $1,284,784,927
Indirect $1,302,920,958
Induced $730,849,145
Total $3,318,555,029
INDUSTRY OUTPUT
Value of Production – Direct $7,678,760,807
Value Added – Direct $3,206,192,198
REPRESENTATIVE
Rick Larsen
EMPLOYMENT
Direct 2,751
Indirect 2,139
Induced 1,264
Total Employment 6,154
COMPENSATION
Direct $231,196,004
Indirect $188,013,860
Induced $91,071,136
Total $510,280,999
INDUSTRY OUTPUT
Value of Production – Direct $1,304,334,975
Value Added – Direct $566,864,747
REPRESENTATIVE
Marie Gluesenkamp Perez
EMPLOYMENT
Direct 3,655
Indirect 5,246
Induced 4,249
Total Employment 13,149
COMPENSATION
Direct $394,431,059
Indirect $454,169,878
Induced $303,398,514
Total $1,151,999,451
INDUSTRY OUTPUT
Value of Production – Direct $2,245,615,938
Value Added – Direct $937,410,544
REPRESENTATIVE
Dan Newhouse
EMPLOYMENT
Direct 706
Indirect 783
Induced 526
Total Employment 2,015
COMPENSATION
Direct $52,866,627
Indirect $66,134,962
Induced $36,063,695
Total $155,065,284
INDUSTRY OUTPUT
Value of Production – Direct $282,733,765
Value Added – Direct $106,137,160
REPRESENTATIVE
Michael Baumgartner
EMPLOYMENT
Direct 1,549
Indirect 2,418
Induced 1,684
Total Employment 5,651
COMPENSATION
Direct $120,628,617
Indirect $199,068,538
Induced $119,922,207
Total $439,619,361
INDUSTRY OUTPUT
Value of Production – Direct $707,561,462
Value Added – Direct $276,465,049
REPRESENTATIVE
Emily Randall
EMPLOYMENT
Direct 2,719
Indirect 2,572
Induced 1,434
Total Employment 6,725
COMPENSATION
Direct $221,134,621
Indirect $221,131,980
Induced $105,467,944
Total $547,734,544
INDUSTRY OUTPUT
Value of Production – Direct $1,553,812,833
Value Added – Direct $630,882,287
REPRESENTATIVE
Pramila Jayapal
EMPLOYMENT
Direct 159
Indirect 53
Induced 35
Total Employment 246
COMPENSATION
Direct $14,345,739
Indirect $7,418,472
Induced $2,936,974
Total $24,701,184
INDUSTRY OUTPUT
Value of Production – Direct $78,730,465
Value Added – Direct $36,572,076
REPRESENTATIVE
Kim Schrier
EMPLOYMENT
Direct 845
Indirect 371
Induced 242
Total Employment 1,458
COMPENSATION
Direct $71,714,145
Indirect $37,378,076
Induced $19,040,414
Total $128,132,634
INDUSTRY OUTPUT
Value of Production – Direct $477,707,598
Value Added – Direct $204,625,840
REPRESENTATIVE
Adam Smith
EMPLOYMENT
Direct 582
Indirect 286
Induced 131
Total Employment 998
COMPENSATION
Direct $50,365,445
Indirect $35,353,973
Induced $10,976,300
Total $96,695,717
INDUSTRY OUTPUT
Value of Production – Direct $258,524,813
Value Added – Direct $113,786,739
REPRESENTATIVE
Marilyn Stickland
EMPLOYMENT
Direct 1,098
Indirect 847
Induced 450
Total Employment 2,395
COMPENSATION
Direct $89,430,890
Indirect $77,566,954
Induced $33,324,001
Total $200,321,846
INDUSTRY OUTPUT
Value of Production – Direct $554,868,721
Value Added – Direct $239,878,009
REPRESENTATIVE
Ryan Zinke
EMPLOYMENT
Direct 2,498
Indirect 2,984
Induced 2,319
Total Employment 7,801
COMPENSATION
Direct $192,507,766
Indirect $211,766,752
Induced $135,491,362
Total $539,765,880
INDUSTRY OUTPUT
Value of Production – Direct $1,312,921,314
Value Added – Direct $300,367,182
EMPLOYMENT
Direct 3,082
Indirect 3,659
Induced 2,840
Total Employment 9,581
COMPENSATION
Direct $232,729,024
Indirect $259,989,112
Induced $165,708,651
Total $658,426,787
INDUSTRY OUTPUT
Value of Production – Direct $1,554,813,646
Value Added – Direct $353,279,341
REPRESENTATIVE
Troy Downing
EMPLOYMENT
Direct 584
Indirect 676
Induced 521
Total Employment 1,780
COMPENSATION
Direct $40,221,258
Indirect $48,222,360
Induced $30,217,289
Total $118,660,907
INDUSTRY OUTPUT
Value of Production – Direct $241,892,333
Value Added – Direct $52,912,159
Applicability Key
The International Code Council (ICC) is the leading developer of model building codes that are adopted for use in the United States.
In some fashion every state has adopted one or more of the codes promulgated by ICC. The exact number of codes, the method of enactment, and their application to buildings varies considerably across the 50 states. This map shows states that have adopted the IBC at a statewide, local, or limited level, and specifies the edition of the code currently being enforced in the state. Because the updating process is dynamic, the information may change and the map may not reflect the most current information. If you feel something is in error, please bring it to our attention at [email protected].
Statewide adoption indicates the code applies to all building construction throughout the state. Local adoption indicates that certain jurisdictions have adopted one or more codes, but the regulation only applies within the legal limits of the jurisdiction. Limited adoption means that one or more state agencies have adopted a code and apply it either to state owned buildings, or buildings that are in some legal manner under the purview of the agency.

Montana
Montana Building Codes Council
Adopted I-Codes:
Applicability (statewide, local, limited): STATEWIDE
The State of Montana Building Codes Council adopts codes for state projects but local cities, counties, etc can adopt a State certified building code.
Mass Timber Adoption
The mass timber provisions went into effect in 2023.
Notes:
The adopted code amendments are found in the following link Building Code Amendments | SBCC (wa.gov). The International Existing Building Code is adopted by reference in the Washington State Building Code. The State of Washington adopted ICC codes may be viewed in read only format over the ICC website.
Page last updated: December 2023

Idaho
Idaho Building Code Boards
Department of Building Safety
Adopted I-Codes:
Applicability (statewide, local, limited): STATEWIDE
The IBC, IRC and IEBC are adopted at the State level, local jurisdictions can amend. Local jurisdictions cannot adopt amendments that are more restrictive than the State codes with the exception of Chapter 11 which cannot be less restrictive. The enabling legislation does not allow one and two family dwellings to be required to have automatic sprinklers.
Here is a summary for code applicability: https://dbs.idaho.gov/faqs/building-frequently-asked-questions/
Mass Timber Adoption
The tall mass timber provisions went into effect in 2021.
Notes:
Page last updated: December 2023
Rafter spans from the AWC Span Calculator are calculated as maximum horizontal (projected) spans. Snow loads used to calculate the maximum horizontal spans are assumed to be uniform and independent of the snow loading condition (i.e. flat roof versus sloped roof, warm roof versus cold roof, balanced versus unbalanced, etc). The designer first determines the appropriate snow load condition and then he/she can use the AWC Span Calculator to calculate the maximum horizontal span for that loading condition.
ASCE 7 Minimum Design Loads for Buildings and Other Structures contains provisions to determine the loads for specific loading conditions based on adjustments to the ground snow load. The AWC Span Calculator does not have the means to calculate these adjustments, so rather than providing drop-down options for snow loads (e.g. 20 psf, 30 psf, etc.), the AWC Span Calculator requires the roof snow load to be calculated and entered manually.
For roof rafters where the maximum horizontal projected rafter span from eave support to ridge is less than 20 feet, ASCE 7 provides a simplification that sets the unbalanced snow load equal to the ground snow load (see Snow Provisions in ASCE 7-05 for more information) which simplifies the determination of the snow load condition. This simplification also applies in ASCE 7-10.
Exposure B as defined in the WFCM and ASCE7-10 is as follows: “Urban and suburban areas, wooded areas, or other terrain with numerous closely spaced obstructions having the size of singe family dwellings or larger.”
Exposure C as defined in the WFCM and ASCE7-10 is as follows: “Open terrain with scattered obstructions including surface undulations or other irregularities having height generally less than 30 feet extending more than 1500 feet from the building site in any quadrant. Exposure C extends into adjacent Exposure B type terrain in the downwind direction for the distance of 1500 feet or 10 times the height of the building or structure, whichever is greater. This category includes open country and grasslands, and open water exposure for less than 1 mile.”
Exposure D as defined in the WFCM is as follows: “Flat unobstructed areas exposed to wind flowing over open water for a distance of a least 1 mile. This exposure shall apply only to those buildings and other structures exposed to the wind coming from over the water. Exposure D extends inland from the shoreline a distance of 1500 feet or 10 times the height of the building or structure, whichever is greater.” The ASCE7-10 definition is similar.
Exposure D is outside the scope of Chapter 3 of the WFCM. It would require either design using WFCM Chapter 2 or ASCE 7. Conversion factors for Exposure D are available in WFCM Table 2.1.3.1 and their applicability is noted in Chapter 2 Table footnotes.
The envelope procedure is a simplified method where GCpf values are developed to provide maximum structural actions from boundary-level wind tunnel tests of low-rise buildings meeting certain limitations. The directional procedure uses GCp values that are based on general aerodynamic theory and is more generally applicable to all buildings.
See Tables 1 and 2 for visually graded lumber species and lumber species combinations and assigned specific gravity per the National Design Specification (NDS) for Wood Construction. Assigned specific gravity in the NDS is an average property based on weight and volume when oven-dry. Bold entries are commonly available lumber species combinations used in International Residential Code and International Building Code span tables for joists and rafters.
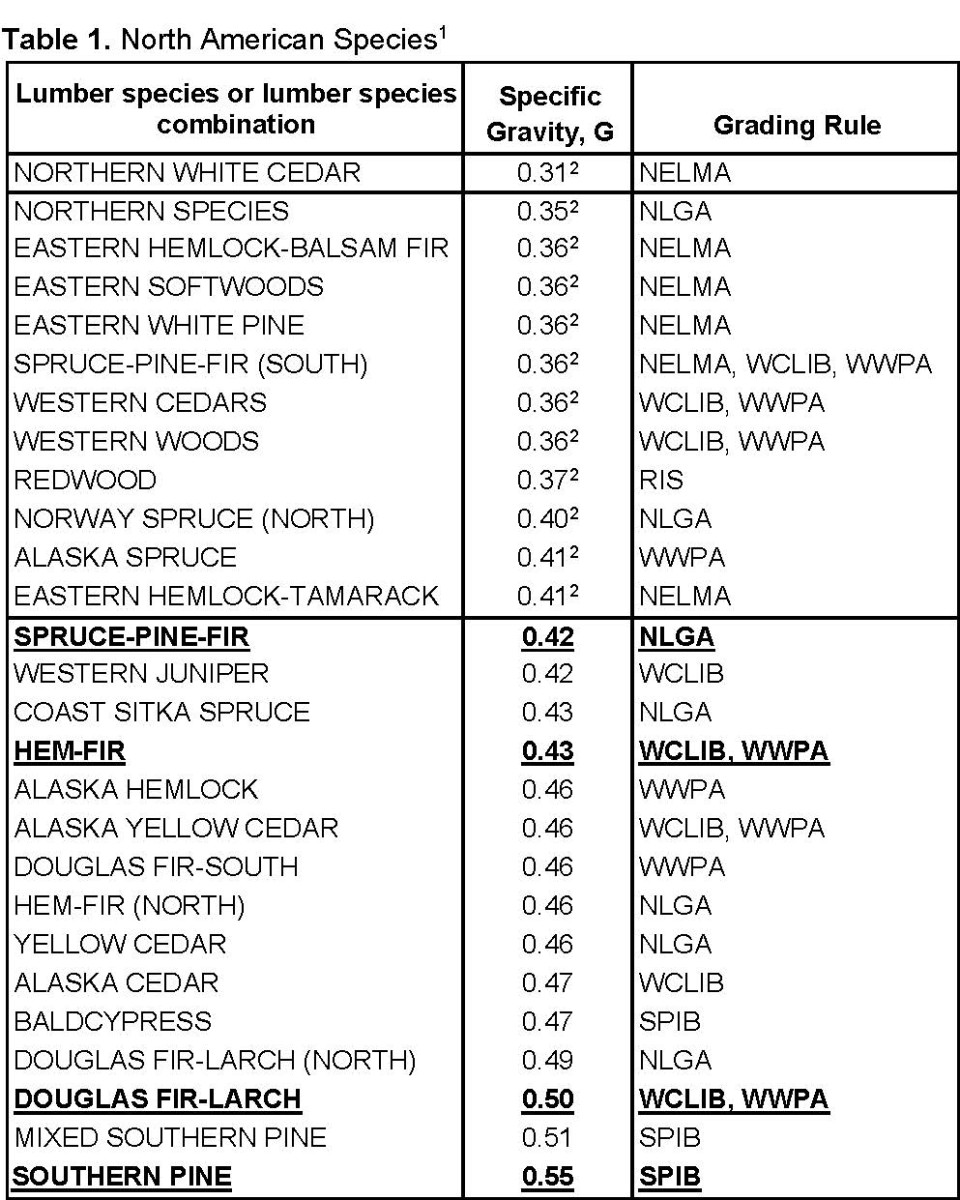
- For a complete listing of lumber species, lumber species combinations and assigned specific gravity, see NDS Supplement Chapter 4 and its Addendum/Errata.
- Lumber with specific gravity less than 0.42 may be associated with special prescriptive fastening requirements in accordance with the International Residential Code (IRC) and International Building Code (IBC). Bold entries are commonly available lumber species combinations used in IRC and IBC span tables for joists and rafters.
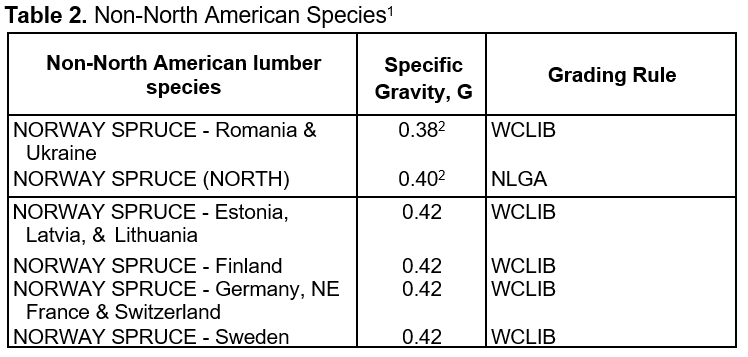
- For a complete listing of lumber species, lumber species combinations and assigned specific gravity, see NDS Supplement Chapter 4 and its Addendum/Errata.
- Lumber with specific gravity less than 0.42 may be associated with special prescriptive fastening requirements in accordance with the International Residential Code (IRC) and International Building Code (IBC).
A list of lumber grading rules writing organizations certified by the American Lumber Standards Committee (ALSC) is provided below.
- NELMA. Standard Grading Rules for Northeastern Lumber; published by the Northeast Lumber Manufacturers Association (NELMA), 272 Tuttle Road, P.O. Box 87A, Cumberland Center, ME 04021; 207.829.6901; 207.829.4293 (fax); e-mail [email protected]
- RIS. Standard Specifications for Grades of California Redwood Lumber; published by the Redwood Inspection Service (RIS), 1500 SW First Avenue, Portland Oregon 97204-2122; 503.224.3930; 503.224.3934 (fax); e-mail [email protected]
- SPIB. Standard Grading Rules for Southern Pine; published by the Southern Pine Inspection Bureau (SPIB), 4555 Spanish Trail, Pensacola, FL 32504; 850.434.2611; 850.434.1290 (fax); e-mail [email protected]
- PLIB/WCLIB. Standard Grading Rules for West Coast Lumber; published by the Pacific Lumber Inspection Bureau (PLIB/WCLIB); 1010 South 336th Street, Suite 210, Federal Way, WA 98003; 253.835.3344; 253.835.3371 (fax); e-mail [email protected]
- WWPA. Western Lumber Grading Rules; published by Western Wood Products Association (WWPA); 1500 SW First Avenue, Portland Oregon 97204-2122; 503.224.3930; 503.224.3934 (fax); e-mail [email protected]
- NLGA. Standard Grading Rules for Canadian Lumber; published by the National Lumber Grades Authority (NLGA); Suite 303 – 409 Granville St., Vancouver, BC V6C 1T2; 604.673.9100; 604.673.9141; e-mail [email protected]
For the most up to date information see: https://alsc.org/lumber-grade-rules-organizations/
With few exceptions, lumber species or lumber species combination (usually in abbreviated form) is a standard component of lumber grade stamps per the American Lumber Softwood Lumber Standard – PS20.
These grade mark components are illustrated below for Visually Graded Lumber.
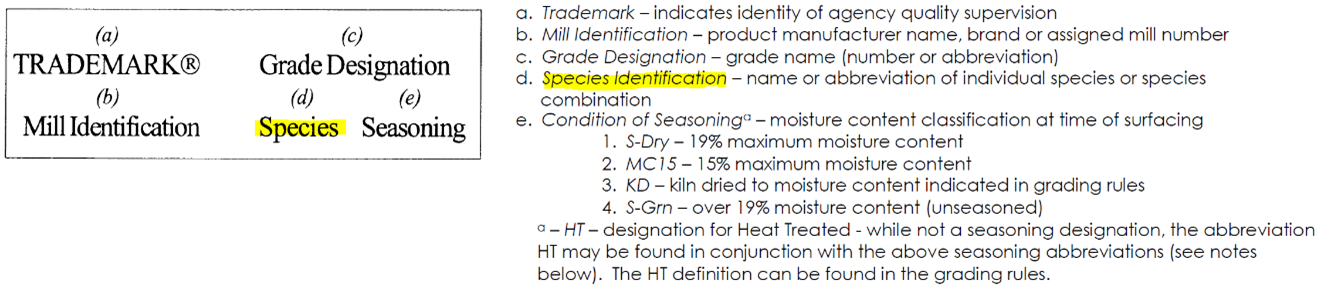
An example grade stamp for S-P-F (or Spruce-Pine-Fir) lumber species combination is shown below:
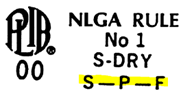
If lumber species or lumber species combinations questions arise based on grade stamp notations, the inspection agency for this example (i.e., Pacific Lumber Inspection Bureau) should be contacted:
See (http://alsc.org/uploaded/LumberProgram_facsimile%20September%202021.pdf) for more information on grade stamps including inspection agency contact information.
Where can I obtain information on designing post frame structures (sometimes referred to as pole buildings or pole barns)?
1. Design values for poles (smaller at the top and buried) and piles (smaller at the bottom and driven) are in the 2005 NDS Chapter 6. Design values for poles and piles were moved to the NDS Supplement: Design Values for Wood Construction in the 2012 Edition.
2. Post-Frame Design Manual (Second Edition) to be published by the Technical & Research Committee of the National Frame Builders Association (NFBA).
NFBA
4840 Bob Billings Parkway
Lawrence, KS 66049-3862
Phone: (800) 557-6957
Local: (785) 843-2444
Fax: (785) 843-7555
E-mail: [email protected]
Website: NFBA (National Frame Building Association)
3. ASAE Post Frame Building Manual
ISBN: 0-929355-29-6
Phone: 800-695-2723
Fax: 269-429-3852
4. The Midwest Plan Service publishes a Structures and Environment Handbookwhich address gussets in section 406.5 under Wood Truss Design. The most recent edition is a 1987 Revised 11th Edition. For ordering information, visit
https://www-mwps.sws.iastate.edu/catalog/construction-farm/structures-and-environment-handbook
Midwest Plan Service
122 Davidson Hall
Iowa State University
Ames, IA 50011-3080
Toll Free: (800) 562-3618
E-mail: [email protected]
Design for Code Acceptance (DCA) #5 provides guidance to post-frame building designers for meeting the requirements of the 2000 International Building Code and to confirm that a properly designed post-frame building is in fact code compliant.
See also General FAQ: “Where can I find information on Timber Poles and Piles?”
See also General FAQ: “What is timber frame construction and where do I find more information about it?”
The Southern Forest Products Association (SFPA) publishes the Permanent Wood Foundations Design and Construction Guide. Download the document here.
AWC’s PWF Design Fabrication Installation (DFI) Manual and Technical Report #7, Permanent Wood Foundation System Basic Requirements (TR7) have both been discontinued and are out of print. ANSI / AWC PWF – Permanent Wood Foundation Design Specification replaces TR7 and has been adopted in the 2009/2012 International Residential Code and 2009/2012 International Building Code. This document primarily addresses structural design requirements. See the SFPA Permanent Wood Foundations Design and Construction Guide for construction details and tabulated data.
- Designing Retaining Walls, Bulkheads and Seawalls of Treated Timber. Author: American Wood Preservers Institute, 1966
- Earth Retaining Structures. Author: W.D. Keeney, AWPI
- Improved Standard Designs Pressure-Treated Timber Crib Walls. AWPI, 1969.
- Available upon e-mail request: [email protected].
Guidance for this issue can be found in the commentary to the Permanent Wood Foundation Design Specification. The PWF commentary states in C5.4.5:
- Since nominal unit shear capacities for shear walls and diaphragms published in the Special Design Provisions for Wind and Seismic (SDPWS) Specification are based on short-term load duration, it is necessary to multiply nominal unit shear capacities for seismic by 0.281. The 0.281 multiplier results from the combination of the 2.0 allowable stress design (ASD) reduction factor and a 0.9/1.6 factor for adjusting from the ten-minute load duration basis for wind and seismic design in the SDPWS to a permanent load duration basis for PWF applications.
Anchor bolt connections designed per SDPWS 4.3.6.4.3 are designed for the shear load in the sill plate. If the shear capacity of a double-sided shear wall is twice that of a single-sided shear wall, the anchor bolt spacing derived based on the anchor bolt shear capacity for a double-sided shear wall would be half the spacing of a single-sided shear wall. Staggering the anchor bolts 1/2″ from the plate edge for a double-sided shear wall provides uplift resistance on each edge of the sill plate equivalent to a single row of anchor bolts located 1/2″ from the plate edge on a single-sided shear wall.
The National Design Specification® (NDS®) Supplement tables list design values for 2x and larger decking.
The American Lumber Standards Committee (ALSC) provides a Policy for Evaluation of Recommended Spans for Span Rated Decking Products. Here’s more information on their website:
https://alsc.org/lumber-recommended-spans-for-decking/
You will need to contact the specific grading agencies to obtain their span ratings for various species. A list of those agencies is on the ALSC website as well.
Lateral design values for lumber diaphragms and shear walls are available in Special Design Provisions for Wind and Seismic.
See also General FAQ, “Where can I get span tables and span table information for lumber? Where can I get decking span tables?” for span information on decking.
Also see Tongue and Groove Roof Decking – WCD #2.
Also see Plank-And-Beam Framing for Residential Buildings – WCD #4.
AWC’s Special Design Provisions for Wind and Seismic, Table 4.2D contains shear capacities for lumber sheathing attached straight and diagonally. Table 4.3D contains shear wall capacities for straight and diagonal lumber sheathing as well.
AWC also publishes Plank and Beam Framing for Residential Buildings (WCD-4) (T14). It shows how this floor and roof framing system, traditionally used in heavy timber structures, can be adapted to home building.
The International Building Code contains design capacities for diagonally sheathed lumber diaphragms in section 2306.3 Wood Diaphragms. Visit http://www.iccsafe.org for ordering information.
Analysis Methods for Horizontal Wood Diaphragms by Jephcott and Dewdney from proceedings of a Workshop on Design of Horizontal Wood Diaphragms (ATC-7-1) conducted by Applied Technology Council on November 19-20, 1980 (25 pages). Visit their website at http://www.atcouncil.org/ to order.
Table 3.17D in the Wood Frame Construction Manual provides maximum shear wall segment aspect ratios for various wood and gypsum assemblies. Also see Special Design Provisions for Wind and Seismic Table 4.3.4. Typically, 3.5:1 is the maximum aspect ratio for design of blocked wood structural panel shear walls. For an 8′ tall shear wall, that would mean 27-1/2″ of full-height sheathing.
The segmented shear wall method considers each full-height segment individually, and has hold-downs at the ends of each full-height segment. The perforated shear wall method only requires hold downs at the very ends of the shear wall length. Both methods are covered in various AWC standards including Special Design Provisions for Wind and Seismic and the Wood Frame Construction Manual.
![]() Read the Perforated Shear Wall Design PDF for more information.
Read the Perforated Shear Wall Design PDF for more information.
Values of apparent shear stiffness, Ga, are tabulated in seismic columns of the SDPWS to facilitate calculation of seismic story drift in accordance with ASCE 7 Minimum Design Loads for Buildings and Other Structures. Values of Ga are equally applicable for calculation of the shear deformation component of total deflection due to wind loads up to the ASD wind unit shear value calculated as vw/2.0. This level of unit shear for wind is identical to 1.4 times the ASD seismic unit shear capacity for which apparent shear stiffness values were originally developed (see SDPWS Commentary C4.2.2).
AWC Wood Frame Construction Manual (WFCM) 2015 Edition is presently referenced in model building codes such as the IBC (International Building Code) and IRC (International Residential Code). The WFCM is an ANSI-approved document that provides engineered and prescriptive requirements for wood frame construction based on dead, live, snow, seismic, and wind loads from ASCE 7-10 Minimum Design Loads for Buildings and Other Structures.
AWC Special Design Provisions for Wind and Seismic (SDPWS) 2015 Edition is presently referenced in model building codes such as the IBC. The SDPWS is an ANSI-approved document that covers materials, design, and construction of wood members, fasteners, and assemblies to resist wind and seismic forces.
Wood has a high strength-to-weight ratio. Since wood is lighter than steel or concrete, there is less mass to move—a critical factor during an earthquake. Wood members connected with steel fasteners create a very ductile (flexible) assembly which is less prone to brittle failures often seen with unreinforced masonry or concrete structures.
Multiple, repetitive wood members (studs, joists, and rafters at 16”-24” on-center) provide redundancy in wood assemblies making them less prone to catastrophic collapse. Wood’s renewability, low life-cycle environmental impacts, and ability to sequester carbon provides the optimal combination of green building and stability for earthquake-prone areas.
Tests have proven the viability of wood frame structures under seismic loads.
For the perforated shear wall method, the internal vertical members are not designed to resist tension due to overturning; but for compression due to overturning the design force would be the same as would result from using a segmented shear wall method. See Special Design Provisions for Wind and Seismic and the Wood Frame Construction Manual.
![]() Read the Perforated Shear Wall Design PDF for more information.
Read the Perforated Shear Wall Design PDF for more information.
Guidance for this issue can be found in the commentary to the Permanent Wood Foundation Design Specification. The PWF commentary states in C5.4.5:
- Since nominal unit shear capacities for shear walls and diaphragms published in the Special Design Provisions for Wind and Seismic (SDPWS) Specification are based on short-term load duration, it is necessary to multiply nominal unit shear capacities for seismic by 0.281. The 0.281 multiplier results from the combination of the 2.0 allowable stress design (ASD) reduction factor and a 0.9/1.6 factor for adjusting from the ten-minute load duration basis for wind and seismic design in the SDPWS to a permanent load duration basis for PWF applications.
A splice is a means of connecting discontinuous top plate members to transfer the design tension force. For the design assumptions in the WFCM, all top plate joints must be spliced in order to maintain diaphragm chord tension capacity. See WFCM Table 3.21 for top plate splice requirements.
The following design standards for wood construction in high wind areas are presently referenced in model building codes such as the IBC (International Building Code) and IRC (International Residential Code):
1. AWC Wood Frame Construction Manual (WFCM) 2015 Edition
2. ICC Standard for Residential Construction in High Wind Regions (ICC-600)
The WFCM is an ANSI approved document that provides engineered and prescriptive requirements for wood frame construction based on dead, live, snow, seismic and wind loads derived from the ASCE 7-10 Minimum Design Loads for Buildings and Other Structures.
ICC-600 presents prescriptive methods to provide wind resistant designs and construction details for residential buildings. The standard is an update to SSTD 10-99 and includes new provisions such as prescriptive designs for wind speeds up to 150 mph with three-second gusts and exterior wall coverings for high wind.
AWC’s Wood Frame Construction Manual (WFCM) for One- and Two-Family Dwellings prescriptively limits cantilevers based on the following conditions, where L is the length of the simple span, center to center of bearing and d is the depth of the joist:
Loadbearing wall, shear wall or non-shear wall <= d
Non-loadbearing, shear wall or non-shear wall <= L/4
Non-loadbearing shear wall <=4d
AWC’s Special Design Provisions for Wind and Seismic, Table 4.2D contains shear capacities for lumber sheathing attached straight and diagonally. Table 4.3D contains shear wall capacities for straight and diagonal lumber sheathing as well.
AWC also publishes Plank and Beam Framing for Residential Buildings (WCD-4) (T14). It shows how this floor and roof framing system, traditionally used in heavy timber structures, can be adapted to home building.
The International Building Code contains design capacities for diagonally sheathed lumber diaphragms in section 2306.3 Wood Diaphragms. Visit http://www.iccsafe.org for ordering information.
Analysis Methods for Horizontal Wood Diaphragms by Jephcott and Dewdney from proceedings of a Workshop on Design of Horizontal Wood Diaphragms (ATC-7-1) conducted by Applied Technology Council on November 19-20, 1980 (25 pages). Visit their website at http://www.atcouncil.org/ to order.
Table 3.17D in the Wood Frame Construction Manual provides maximum shear wall segment aspect ratios for various wood and gypsum assemblies. Also see Special Design Provisions for Wind and Seismic Table 4.3.4. Typically, 3.5:1 is the maximum aspect ratio for design of blocked wood structural panel shear walls. For an 8′ tall shear wall, that would mean 27-1/2″ of full-height sheathing.
AWC Wood Frame Construction Manual (WFCM) 2015 Edition is presently referenced in model building codes such as the IBC (International Building Code) and IRC (International Residential Code). The WFCM is an ANSI-approved document that provides engineered and prescriptive requirements for wood frame construction based on dead, live, snow, seismic, and wind loads from ASCE 7-10 Minimum Design Loads for Buildings and Other Structures.
AWC Special Design Provisions for Wind and Seismic (SDPWS) 2015 Edition is presently referenced in model building codes such as the IBC. The SDPWS is an ANSI-approved document that covers materials, design, and construction of wood members, fasteners, and assemblies to resist wind and seismic forces.
Wood has a high strength-to-weight ratio. Since wood is lighter than steel or concrete, there is less mass to move—a critical factor during an earthquake. Wood members connected with steel fasteners create a very ductile (flexible) assembly which is less prone to brittle failures often seen with unreinforced masonry or concrete structures.
Multiple, repetitive wood members (studs, joists, and rafters at 16”-24” on-center) provide redundancy in wood assemblies making them less prone to catastrophic collapse. Wood’s renewability, low life-cycle environmental impacts, and ability to sequester carbon provides the optimal combination of green building and stability for earthquake-prone areas.
Tests have proven the viability of wood frame structures under seismic loads.
AWC’s Wood Construction Data #1 Details for Conventional Wood Frame Construction, which provides proper methods of construction in wood frame buildings, with information on features which contribute to the satisfactory performance of wood structures.
AWC publishes the Wood Frame Construction Manual for One- and Two-Family Dwellings to provide solutions based on engineering analysis, in accordance with recognized national codes and standards. Like conventional construction, the engineered solutions are provided in a prescriptive format.
The WFCM does not require special consideration of floor plan offsets up to 4′. If the floor plan offset exceeds 4′ deep, the provisions of 1.1.3.3a would apply. The building would be designed as:
1) separate structures attached at the wall line at the offset(s); or,
2) a rectangular building with perimeter dimensions that inscribe the entire structure including the offsets.
The appropriate design method would be decided by the complexity of the building shape and the load path required to transfer the forces.
The WFCM uses the envelope procedure, which is a simplified method where GCpf values are developed to provide maximum structural actions from boundary-level wind tunnel tests of low-rise buildings meeting certain limitations. The directional procedure uses GCp values that are based on general aerodynamic theory and is more generally applicable to all buildings.
Exposure B as defined in the WFCM and ASCE7-10 is as follows: “Urban and suburban areas, wooded areas, or other terrain with numerous closely spaced obstructions having the size of singe family dwellings or larger.”
Exposure C as defined in the WFCM and ASCE7-10 is as follows: “Open terrain with scattered obstructions including surface undulations or other irregularities having height generally less than 30 feet extending more than 1500 feet from the building site in any quadrant. Exposure C extends into adjacent Exposure B type terrain in the downwind direction for the distance of 1500 feet or 10 times the height of the building or structure, whichever is greater. This category includes open country and grasslands, and open water exposure for less than 1 mile.”
Exposure D as defined in the WFCM is as follows: “Flat unobstructed areas exposed to wind flowing over open water for a distance of a least 1 mile. This exposure shall apply only to those buildings and other structures exposed to the wind coming from over the water. Exposure D extends inland from the shoreline a distance of 1500 feet or 10 times the height of the building or structure, whichever is greater.” The ASCE7-10 definition is similar.
Exposure D is outside the scope of Chapter 3 of the WFCM. It would require either design using WFCM Chapter 2 or ASCE 7. Conversion factors for Exposure D are available in WFCM Table 2.1.3.1 and their applicability is noted in Chapter 2 Table footnotes.
Yes. For each wind direction, there can be a different exposure.
In the WFCM, Mean Roof Height is defined as “the distance from the average grade to the average roof elevation.” See WFCM Figure 1.2.
The WFCM is limited to a Mean Roof Height (MRH) of 33′ or less, but the envelope method in ASCE 7-10 that is used in the WFCM has a limit of 60′.
No. Portal frames are outside the scope of the WFCM.
There are currently no WFCM Excel, Mathcad, or other pre-programmed sheets for general use. There is an online span and connection calculator that can be accessed through the AWC website, www.awc.org. Also, WoodWorks Software includes a shear wall module that generates wind pressure and resulting diaphragm loads per ASCE 7-10.
The WFCM designs with exterior shear walls. If the building is broken into individual separate structures, there would be interior shear walls that extend to the roof diaphragm unless an alternative design is provided.
Yes. WFCM Section 3.2.6.1 requires ridge straps, but provides an exception for collar ties: “Ridge straps are not required when collar ties (collar beams) of nominal 1×6 or 2×4 lumber are located in the upper third of the attic space and attached to rafters in accordance with Table A-3.6.”
See the following article for more information:
http://www.jlconline.com/roofing/conventional-roof-framing-a-codes-eye-view_o.aspx
All roof and wall sheathing designs are based on 8d common or 10d box nails, regardless of sheathing type or thickness. Table 3.1 in the WFCM provides a complete nailing schedule.
For unblocked diaphragms, the blocking requirements for floor and roof diaphragm bracing to transfer wind loads from exterior walls into the floor/roof diaphragm are based on the number of bay spacings required to get the load into the floor and roof sheathing. See WFCM 3.3.5 and 3.5.5.
See WFCM section 3.5.1.3 for depth to thickness ratios requiring blocking. Shear transfer through rafter/ceiling joist to top plate connections is assumed to happen without blocking if depth-to-thickness ratios are in accordance with WFCM 3.5.1.3. This is for diaphragm capacities in accordance with WFCM chapter 3 requirements
Connectors should be detailed to align the uplift load on the same side of the stud avoiding cross grain bending in the top plate. See WFCM Figure 3.2k for an example.
From the WFCM Commentary: “Uplift for design of rafters, roof cladding, and roof sheathing attachment is calculated using Components and Cladding (C&C) loads. Uplift connections for roof assemblies are calculated using enveloped Main Wind Force-Resisting System (MWFRS) loads. The rationale for using MWFRS loads for computing the uplift of roof assemblies recognizes that the spatial and temporal pressure fluctuations that cause the higher coefficients for components and cladding are effectively averaged by wind effects on different roof surfaces consistent with the definitions of C&C and MWFRS loads in ASCE 7. Also note that C&C loads are used to calculate wall bending loads whereas MWFRS loads are used to calculate combined bending and axial loads. Within the scope of the WFCM, C&C bending loads control.” See the following paper for more details:
Considerations in Wind Design of Wood Structures ![]()
Yes. See WFCM 3.2.6.1 for ridge connection requirements.
Yes. WFCM Section 3.4.4.2.3 allows a single hold-down to be used to resist overturning forces in both directions where full height shear wall segments meet at a corner, provided the corner framing in the adjoining walls is adequately fastened to transfer the load.
WFCM 2.1.3.3a allows loadbearing walls to be 20′ in height, but requires engineering analysis. WFCM 3.1.3.3a limits prescriptively designed loadbearing wall heights to 10′ and non-loadbearing wall heights to 20′.
If you are asking about mechanical connectors, that is a question for the connector manufacturer. For multiple fasteners and/or fastener types, there are specific design requirements (see NDS 10.1.4 and 10.2.2). In general, capacities of different fastener types cannot be directly summed.
WFCM 2.1.3.4d and 3.1.3.4d limits the maximum roof slope to 12:12.
Yes. WFCM Section 3.2.6.1 requires ridge straps, but provides an exception for collar ties: “Ridge straps are not required when collar ties (collar beams) of nominal 1×6 or 2×4 lumber are located in the upper third of the attic space and attached to rafters in accordance with Table A-3.6.”
No. For lateral stability of floor joists and rafters, blocking requirements are based on the d/b ratio. See WFCM 3.3.1.4 and 3.5.1.3.
In the WFCM, the total load on a sloped roof has been tabulated in terms of vertical projection and horizontal dimensions.
We do not have any examples. TPI may have details.
When rafters have a pitch greater than 12:12, they behave more like beam-columns, where the member takes both axial and bending loads. This scenario is not considered in prescriptive rafter design tables and calculations.
Unless otherwise stated, all calculations are based on Allowable Stress Design (ASD) load combinations using loads from ASCE 7-10 Minimum Design Loads for Buildings and Other Structures. For wind, ASCE 7-10 calculations are based on 700-year-return-period “three-second gust” wind speeds between 110 and 195 mph. Snow loads are designed in accordance with ASCE7-10 for buildings in regions with ground snow loads between 0 and 70 psf. Both balanced and unbalanced snow load conditions are considered in design.
Use of staples for shear walls and diaphragms would be at the discretion of the code official.
The scope of the WFCM in Chapter 1 states it can be used for Exposures B, C, and D; however, Chapter 3 limits the scope for the prescriptive chapter to Exposures B and C. If you need to design for Exposure D, you will need to do it per WFCM Chapter 2 in accordance with appropriate table footnotes.
A dropped header is a header that is installed below the roof or floor framing with a short wall (knee wall or cripples) between the header and the top plate. Under some “dropped” conditions, a header may be assumed to be fully-braced and a design reduction does not need to be applied to account for buckling, which will allow for a longer span than a raised header condition.
The WFCM defines a rafter tie as a structural framing member located in the lower third of the attic space that ties rafters together to resist thrust from gravity loads on the roof. The WFCM defines a collar tie as a structural member located in the upper third of the attic space that ties rafters together to resist separation of the tops of the rafters due to uplift in a ridge board configuration. Ceiling joists or rafter ties resist outward thrust of the rafters in the lower third of the attic space. See WFCM Figures 3.10b-c. See WFCM 3.2.6.1 for ridge connection requirements.
If there are no rafter ties or ceiling joists (or if the rafter ties or ceiling joists aren’t adequately attached to the rafters), the roof framing must be constructed using a ridge beam so the rafters do not impose an outward thrust at the top of the wall.
NDS Archives + Historical Design Values
1991-1997 NDS Commentary – Historical Development
Wood Handbook – Wood as an Engineering Material
Wood and Timber Condition Assessment Manual, Second Edition – Electronic (PDF)
by Robert J. Ross and Robert H. White
Here’s contact information for the lead author:
Dr. Robert J. Ross
Email: [email protected]
Phone: (608) 231-9221
Website: http://www.fs.fed.us/research/people/profile.php?alias=rjross
Other resources:
Evaluation, Maintenance and Upgrading of Wood Structures: A Guide and Commentary. Published by: ASCE (Proceedings of a session at Structures Congress, 1986). Edited by: Alan Freas. Available at https://play.google.com/store/books/details?id=6lghAGA7OLwC
Evaluation and Upgrading of Wood Structures: Case Studies. Published by: ASCE (Proceedings of a session at Structures Congress, 1986). Edited by: Vijay K. A. Gopu. Available at http://cedb.asce.org/CEDBsearch/record.jsp?dockey=0050270
ISBN # 0872625508
Grading of existing timbers
West Coast Lumber Inspection Bureau (WCLIB) will grade existing timbers. Here’s contact information:
WEST COAST LUMBER INSPECTION BUREAU
PO Box 23145
Portland, Oregon 97281-3145
503-639-0651
Fax: 503-684-8928
http://www.wclib.org/
Historical Considerations in Evaluating Timber Structures
R. L. Tuomi and R. C. Moody, Engineers
Forest Products Laboratory U.S. Department of Agriculture
http://www.fpl.fs.fed.us/documnts/fplgtr/fplgtr21.pdf
Fire and Smoke Repair
Restoration Industry Association Guidelines for Fire & Smoke Damage Repair, 2nd Edition
Classic texts online
Rankin, William John MacQuorn (1866): Useful Rules and Tables Relating to Mensuration, Engineering, Structures, and Machines, Charles Griffn and Company, London, UK.
Includes timber design properties (see p. 199).
Johnson, J.B. (1904): The Materials of Construction – A Treatise for Engineers on the Strength of Engineering Materials, Fourth Edition, John Wiley & Sons, New York, USA.
Comprehensive strength of materials text for typical materials of the time, including timber (see p. 236-238).
Ketchum, Milo S. (1918): Structural Engineers Handbook – Data for the Design and Construction of Steel Buildings and Bridges, Second Edition, McGraw-Hill Book Company Inc., New York, USA.
Includes timber Bridges and trestles (see p. 298).
Jacoby, H.S. (1909): Structural Details or Elements of Design in Timber Framing, John Wiley & Sons, NY, USA.
An early authoritative text on timber detailing, joints, connections, design, and more.
Common board grades (less than 2″ thick) used for decking or sheathing do not typically reflect design values for the lumber. When design values are required for boards used in design, stress-rated boards of nominal 1”, 1-1/4”, and 1-1/2” thickness, 2” and wider, of most species, are permitted to use the design values shown in the NDS Supplement for Select Structural, No. 1 & Btr, No. 1, No. 2, No. 3, Stud, Construction, Standard, Utility, and Clear Structural grades as shown in the 2” to 4” thick categories, when graded in accordance with the stress-rated board provisions in the applicable grading rules. Information on stress-rated board grades applicable to the various species is available from the respective grading rules agencies. See NDS Supplement Table 1B, footnote 1 and NDS Supplement Tables 4A and 4B, footnote 2 for more information.
With assistance from AWC, a report on anchor bolts connecting wood sill plates to concrete with edge distances typically found in wood frame construction is complete and available.
National Design Specification for Wood Construction (Publication #T-01) – Nationally recognized design guide for wood structures. Includes general requirements, design provisions and formulas, and data on structural connections (nails, bolts, screws, split ring, and shear plate connectors, and timber rivets).
The NDS Commentary provides background on development of NDS design provisions for bolt, lag screw, wood screw, nail, split ring, shear plate, and timber rivet connections.
Creep is the time-dependent deformation of loaded member undergoing elastic deformation.
The National Design Specification for Wood Construction (NDS) addresses creep in section 3.5.2-Long Term Loading. Under long term loading, the expected (average) deflection would be 1.5 times the initial deflection for seasoned lumber and 2.0 times the initial deflection for unseasoned lumber. Long term loading will cause a permanent set of about 1/2 the creep deflection.
The creep deflection varies anywhere from zero to twice the initial deflection. This means that the total deflection can vary from the initial deflection to as much as three times the initial deflection.
Forest Products Laboratory’s Wood Handbook – Chapter 4: Mechanical Properties of Wood
The NDS Supplement provides design values for Bald Cypress.
The National Design Specification® (NDS®) Supplement tables list design values for 2x and larger decking.
The American Lumber Standards Committee (ALSC) provides a Policy for Evaluation of Recommended Spans for Span Rated Decking Products. Here’s more information on their website:
https://alsc.org/lumber-recommended-spans-for-decking/
You will need to contact the specific grading agencies to obtain their span ratings for various species. A list of those agencies is on the ALSC website as well.
Lateral design values for lumber diaphragms and shear walls are available in Special Design Provisions for Wind and Seismic.
See also General FAQ, “Where can I get span tables and span table information for lumber? Where can I get decking span tables?” for span information on decking.
Also see Tongue and Groove Roof Decking – WCD #2.
Also see Plank-And-Beam Framing for Residential Buildings – WCD #4.
Shear parallel to grain (Fv) values along with compression perpendicular to grain (Fc?), bending (Fb), tension parallel to grain (Ft), compression parallel to grain (Fc), and modulus of elasticity (E) values are located in the NDS supplement, Design Values for Wood Construction.
Chapter 5 of the NDS contains design information for glued-laminated timber.
Model building codes recognize finger-jointed lumber for the same structural applications as solid sawn lumber with certain qualifications.
AWC’s code adopted National Design Specification® (NDS®) for Wood Construction, which specifies finger jointed lumber as having the same design values as solid sawn lumber.
From Chapter 4 of the 2005 NDS:
4.1.2.1 When the reference design values specified in the NDS are used, the lumber, including end-jointed or edge-glues lumber, shall be identified by the grade mark of, or certificate of inspection issued by, a lumber grading or inspection bureau or agency recognized as being competent (see Reference 31). A distinct grade mark of a recognized lumber grading or inspection bureau or agency, indicating that joint integrity is subject to qualification and quality control, shall be applied to glued lumber products.
4.1.6 Reference design values for sawn lumber are applicable to structural end-jointed or edge-glued lumber of the same species and grade. Such use shall include, but not be limited to light framing, studs, joists, planks, and decking. When finger jointed lumber is marked “STUD USE ONLY” or “VERTICAL USE ONLY” such lumber shall be limited to use where any bending or tension stresses are of short duration.
The NDS is referenced in all major model building codes in the U.S.
To obtain a copy of the NDS, which is part of the 2005 Wood Design Package, call the AWC publications department at 1-800-890-7732 or visit the website.
Grade Rules
End-joined lumber can be manufactured in different ways. Finger-joints or butt-joints are typical methods of joinery. The standards under which finger-jointed lumber is manufactured are the grading rules for end-joined pieces. These grade rules are promulgated like any other lumber grade rule and are ultimately reviewed by and approved by the American Lumber Standard Committee (ALSC). Finger joints for use in structural applications bear the grade stamp of an agency certified and approved by the Board of Review of ALSC.
Adhesives
ALSC recently modified its Glued Lumber Policy to add elevated-temperature adhesive performance requirements for end-jointed lumber intended for use in fire resistance-rated assemblies. End-jointed lumber manufactured with an adhesive which meets these new requirements is being designated as “Heat Resistant Adhesive” or “HRA” on the grade stamp. End-jointed lumber manufactured with an adhesive not tested or not qualified as a Heat Resistant Adhesive will be designated as “Non-Heat Resistant Adhesive” or “non-HRA” on the grade stamp, and will continue to meet building code requirements when used in unrated construction.
Adhesives used in finger-jointed lumber are of two basic types, depending on whether they are to be used for members with long duration bending loads like floor joists or short duration bending and tension loads like wall studs. Wood products using both types of adhesives have undergone extensive testing by manufacturers. Glued connections in products using the first adhesive type, containing phenolic resins, are sometimes referred to as “Structural Finger Joint,” and typically can be found in structural panels and glued-laminated timber. These products may be used interchangeably with solid sawn lumber in terms of strength and end use, including vertical or horizontal load applications. The second type of adhesive, typically containing polyvinyl compounds, is used with products that are then marked “VERTICAL USE ONLY” or “STUD USE ONLY.” These wood products may be used interchangeably with solid sawn lumber in terms of strength and are intended for applications where bending and tension stresses are of short duration, such as typically found in stud walls.
Does gypsum board provide lateral support to a wall stud assembly—to prevent it from buckling about the weak axis due to axial loads, and also to ensure that it is fully braced for bending when subjected to lateral loads?
The following references may be helpful in this regard:
RE: AXIAL LOADS
From the 1997 NDS® Commentary (Clause 3.6.7 – Lateral Support of Arches, Studs and Compression Chords of Trusses). Last paragraph (page 37) states:
“Use of the depth of the stud as the least dimension in calculating the slenderness ratio in determining the axial load-carrying capacity of normally sheathed or clad light frame wall systems also is long standing practice. Experience has shown that any code allowed thickness of gypsum board, hardwood plywood, or other interior finish adequately fastened directly to studs will provide adequate lateral support of the stud across its thickness irrespective of the type or thickness of exterior sheathing and/or finish used.”
From the 2001 NDS (Appendix A Clause A.11.3):
“When stud walls in light frame construction are adequately sheathed on at least one side, the depth, rather than breadth of the stud, shall be permitted to be taken as the least dimension in calculating the l_e/d ratio. The sheathing shall be shown by experience to provide lateral support and shall be adequately fastened.”
RE: LATERAL (BENDING) LOADS
From the 2001 NDS (Clause 4.4.1 Stability of Bending Members):
Clause 4.4.1.2 provides the following limits on the nominal depth-to-breadth ratios (d/b) for sawn lumber in order to use C_L = 1.0.:
“(a) d/b less than or equal to 2; no lateral support shall be required.
(b) 2 < d/b and less than or equal to 4; the ends shall be held in position, as by full depth solid blocking, bridging, hangers, nailing, or bolting to other framing members, or other acceptable means.
(c) 4 < d/b and less than or equal to 5; the compression edge of the member shall be held in line for its entire length to prevent lateral displacement as by adequate sheathing or subflooring, and ends at points of bearing shall be held in position to prevent rotation and/or lateral displacement.”
More requirements are also specified for greater d/b ratios; however, for wood studs, the range noted above should be adequate. For example, the d/b ratio for a 2×4 stud is (4/2 = 2), for a 2×6 stud is (6/2 = 3). Given these ratios, for pure bending, all that is required is that the ends be held in position.
RE: COMBINED BENDING AND AXIAL LOADS
Clause 4.4.1.3 also states:
“If a bending member is subjected to both flexural and axial compression, the depth to breadth ratio shall be no more than 5 to 1 if one edge is firmly held in line….”
So if the interior stud wall is sheathed with gypsum on both sides and is subjected to combined axial and lateral loads, for typical stud dimensions such as a 2×4 and 2×6, which result in relatively low d/b ratios (lower than 5), Clause 4.4.1.3 would suggest that a C_L = 1.0 could be used as well.
Changes in the 1991 NDS to dimension lumber design values are based on a comprehensive testing program conducted by the North American forest products industry called In-Grade Testing. Here’s an excerpt from section 4.2.3.2 of the NDS Commentary:
“The testing program conducted over an eight year period, involved the destructive testing of 70,000 pieces of lumber from 33 species groups. A new test method standard, ASTM D4761, was developed to cover the mechanical test methods used in the program. A new standard practice, ASTM D1990, was developed to codify procedures for establishing design values for visually graded dimension lumber from test results obtained from in-grade test programs.”
There are also a couple of 5-6 page articles on the subject:
“Lumber Design Values from In-Grade Test Results,” Wood Design Focus, Volume 2, No. 2, 1991, Forest Products Society.
“In-Grade: What it means,” Western Wood Products Association, Rev. 12-94.
In addition to these references, the Wood Handbook (Chapter 7), published by the Forest Products Lab, deals with lumber stress grades and derivation of design properties. It gives a good overview of the development of “small-clear” design values and “in-grade.” It also provides some additional references for further study.
Link to Chapter 7 on the FPL website
Note that concurrent with development of new design values in the 1991 NDS, behavioral equations for column, beam, and beam-column design also changed as a result of the In-Grade Testing program. Therefore, an advisory was issued with the 1991 NDS indicating that new design values were to be used simultaneously with new design equations and pre-1991 design values be used with pre-1991 design equations.
Design provisions and design values in the National Design Specification® for Wood Construction (NDS®) are applicable to lag screws conforming to ANSI/ASME Standard B18.2.1-1981. Tabulated design values are based on lag screws conforming to ANSI/ASME Standard B18.2.1-1981 and having assumed bending yield strengths provided in the table footnotes. Note that self-tapping lag screws are not addressed in ANSI/ASME B18.2.1 and are not specifically covered by provisions of the NDS. Specifically, the NDS does not address fabrication and assembly requirements, withdrawal design values, or lateral design values for self-tapping lag screws.
For self-tapping lags screws with dimensions similar to those provided in ANSI/ASME B18.2.1, the general form of the yield equations should apply for determining lateral design values. Accordingly, tabulated design values would also apply provided that the self-tapping lag screw dimensions meet or exceed the dimensions ASME B18.2.1 and the bending yield strength equals or exceeds the assumed bending yield strength in the table footnotes. In order to use lateral design provisions of the NDS, it must be assumed that fabrication and assembly of connections using self-tapping screws permits the development of the full bearing strength of the wood beneath the lag screw or permits yielding of the lag screw (i.e. installation does not damage the wood member or connection).
Finally, it should be noted that NDS Section 7.1.1.4 indicates that connections, other than those covered in the provisions, are not precluded from use where it is demonstrated by analysis, tests, or extensive experience that the connections will perform satisfactorily in their intended end use.
Full diameter screws have a larger unthreaded portion than the root diameter. Reduced diameter body screws’ shank portion is the same as the root diameter of the screw. See the figure in Table L2 (also below) of the 2005 NDS for more clarification.

The reason the root diameter was used in the 2005 NDS was to better address the use of “reduced body diameter” lag screws (vs. “full body diameter”)—and to better address the condition where the full length of the fastener is threaded.
Because “reduced body diameter” lag screws have a shank diameter approximately equal to the root diameter of “full body diameter” lag screws, design values for these fasteners are smaller than those provided in the 1997 NDS edition for “full body diameter” lag screws.
Root diameter (Dr), rather than the shank diameter, is used to calculate the tabulated lag screw design values, such as the ones shown in Table 11J.
Please refer to Section 11.3.6 Dowel Diameter in the 2005 NDS where it states:
“11.3.6.1 When used in Tables 11.3.1A and 11.3.1.B, the fastener diameter shall be taken as D for unthreaded full-body fasteners and Dr for reduced body diameter fasteners or threaded fasteners except as provided in 11.3.6.2…”
Where 11.3.6.2 states:
” 11.3.6.2 For threaded full body fasteners (see Appendix L), D shall be permitted to be used in lieu of Dr when the bearing length of the threads does not exceed 1/4 of the full bearing length in the member holding the threads…Alternatively, a more detailed analysis accounting for the moment and bearing resistance of the threaded portion of the fastener shall be permitted (see Appendix I).”
Design Aid 1 – Application of Technical Report 12 for Lag Screw Connections provides one alternate method of accounting for the moment and bearing resistance of the threaded portion of the fastener and moment acting along the length of the fastener as provided in Technical Report 12 (TR12) – General Dowel Equations for Calculating Lateral Connection Values.
The NDS Format Conversion Factor, KF, converts reference design values (allowable stress design values based on normal load duration) to LRFD reference resistances as described in ASTM D5457 Standard Specification for Computing Reference Resistance of Wood-Based Materials and Structural Connections for Load and Resistance Factor Design. The expression for KF is a constant divided by the resistance factor, Φ, and includes the following:
- a conversion factor to adjust an allowable design value to a strength level design value (embedded in the constant),
- a conversion factor to adjust from a 10-year (long-term) load duration to a 10-minute (short-term) load duration basis (embedded in the constant), and
- a conversion factor to adjust for a specified resistance factor, Φ (expressed independently in the denominator)
ASTM Standard F1667 Standard for Driven Fasteners: Nails, Spikes, and Staples provides dimensional tolerances. The National Design Specification (NDS) provides design values for common wire, box, or sinker nails.
1. ACI 318-02 Building Code Requirements for Structural
Concrete, American Concrete Institute,
Farmington Hills, MI, 2002.
Available at http://www.iccsafe.org.
2. ACI 530-99/ASCE 5-99/TMS 402-99 Building Code Requirements for Masonry Structures,
American Concrete Institute,
Farmington Hills, MI, 1999.
Available from the ASCE Bookstore.
3. AISI 1035 Standard Steels,
American Iron and Steel Institute,
Washington, DC, 1985.
4. ANSI Standard A190.1-2002, Structural Glued Laminated Timber.
APA – The Engineered Wood Association
http://www.apawood.org/
5. ANSI/ASCE Standard 7-02, Minimum Design Loads for
Buildings and Other Structures, American Society of Civil
Engineers, Reston, VA, 2003.
Available from the ASCE Bookstore.
6. ANSI/ASME Standard B1.1-1989, Unified Inch Screw
Threads UN and UNR Thread Form, American Society of
Mechanical Engineers, New York, NY, 1989.
Available from the ASME website.
7. ANSI/ASME Standard B18.2.1-1996, Square and Hex
Bolts and Screws (Inch Series), American Society of Mechanical Engineers, New York, NY, 1997.
Available from the ASME website.
8. ANSI/ASME Standard B18.6.1-1981 (Reaffirmed 1997),
Wood Screws (Inch Series), American Society of Mechanical Engineers, New York, NY, 1982.
Available from the ASME website.
9. ANSI/TPI 1-2002 National Design Standard for Metal Plate Connected Wood Trusses,
Truss Plate Institute, 2002.
Available from the Truss Plate Institute.
10.ASTM Standard A36-04, Specification for Standard Structural Steel, ASTM, West Conshohocken, PA, 2004.
Available from www.astm.org.
11. ASTM Standard A47-99, Specification for Ferritic Malleable Iron Castings, ASTM,
West Conshohocken, PA, 1999.
Available from www.astm.org.
12. ASTM A 153-03, Specification for Zinc Coating (Hot Dip) on Iron and Steel Hardware, ASTM,
West Conshohocken, PA, 2003.
Available from www.astm.org.
13. ASTM A 370-03a, Standard Test Methods and Definitions for Mechanical Testing of Steel Products, ASTM, West Conshohocken, PA, 2003.
Available from www.astm.org.
14. ASTM Standard A 653-03, Specification for Steel Sheet, Zinc Coated (Galvanized) or Zinc Iron Alloy Coated (Galvannealed) by the Hot Dip Process, 2003.
Available from www.astm.org.
15. ASTM Standard D 25-91, Round Timber Piles, ASTM,
West Conshohocken, PA, 1991.
Available from www.astm.org.
16. ASTM Standard D 245-00e1 (2002), Establishing Structural Grades and Related Allowable Properties for Visually
Graded Lumber, ASTM, West Conshohocken, PA, 2002.
Available from www.astm.org.
17. ASTM Standard D 1760-01, Pressure Treatment of Timber Products, ASTM, West Conshohocken, PA, 2001.
Available from www.astm.org.
18. ASTM Standard D 1990-00e1 (2002), Establishing Allowable Properties for Visually Graded Dimension Lumber from In-Grade Tests of Full Size Specimens, ASTM, West Conshohocken, PA, 2002.
Available from www.astm.org.
19. ASTM Standard D 2555-98e1, Establishing Clear Wood Strength Values, ASTM,
West Conshohocken, PA, 1998.
Available from www.astm.org.
20. ASTM Standard D 2899-95, Establishing Design Stresses for Round Timber Piles, ASTM, West Conshohocken, PA, 1995.
Available from www.astm.org.
21. ASTM Standard D 3200-74(2000), Establishing Recommended Design Stresses for Round Timber Construction Poles, ASTM,
West Conshohocken, PA, 2000.
Available from www.astm.org.
22. ASTM Standard D 3737-03, Establishing Stresses for
Structural Glued Laminated Timber (Glulam), ASTM, West
Conshohocken, PA, 2003.
Available from www.astm.org.
23. ASTM Standard D 5055-04, Establishing and Monitoring Structural Capacities of Prefabricated Wood I Joists, ASTM, West Conshohocken, PA, 2004.
Available from www.astm.org.
24. ASTM Standard D 5456-03, Evaluation of Structural
Composite Lumber Products, ASTM, West Conshohocken,
PA, 2003.
Available from www.astm.org.
25. ASTM Standard D5764-97a (2002), Test Method for Evaluating Dowel Bearing Strength of Wood and Wood Base Products,ASTM, West Conshohocken, PA, 2002.
Available from www.astm.org.
26. ASTM Standard D5933-96 (2001) , Standard Specification for 2-5/8 in. and 4 in. Diameter Metal Shear Plates for Use in Wood Construction, ASTM, West Conshohocken,PA, 2001.
Available from www.astm.org.
27. ASTM Standard F 606-02e1, Determining the MechanicalProperties of Externally and Internally Threaded Fasteners,
Washers, and Rivets, ASTM,
West Conshohocken, PA, 2002.
Available from www.astm.org.
28. ASTM Standard F1575-03, Standard Test Method for Determining Bending Yield Moment of Nails, ASTM, West
Conshohocken, PA, 2003.
Available from www.astm.org.
29. ASTM Standard F1667-03, Standard for Driven Fasteners:
Nails, Spikes, and Staples, ASTM, West Conshohocken,
PA, 2003.
Available from www.astm.org.
30. AWPA Book of Standards, American Wood Preservers’ Association, Granbury, TX, 2003.
Available from the AWPA store.
31. American Softwood Lumber Standard, Voluntary Product
Standard PS 20-99, National Institute of Standards and
Technology, U.S. Department of Commerce, 1999.
Available at ALSC’s website.
32. Design/Construction Guide Diaphragms and Shear Walls,
Form L350, APA – The Engineered Wood Association,
Tacoma, WA, 2001.
Available from the APA.
33. Engineered Wood Construction Guide, Form E30, APA – The
Engineered Wood Association, Tacoma, WA, 2001.
Available from the APA.
34. Plywood Design Specification and Supplements, Form
Y510, APA – The Engineered Wood Association, Tacoma,
WA, 1997.
Available from the APA.
35. PS1-95, Construction and Industrial Plywood, United
States Department of Commerce, National Institute of Standards
and Technology, Gaithersburg, MD, 1995.
36. PS2-92, Performance Standard for Wood-Based Structural-
Use Panels, United States Department of Commerce, National
Institute of Standards and Technology, Gaithersburg, MD, 1992.
37. SAE J412, General Characteristics and Heat Treatment of
Steels, Society of Automotive Engineers, Warrendale, PA,
1995.
Available from the SAE website.
38. SAE J429, Mechanical and Material Requirements for Externally Threaded Fasteners, Society of Automotive
Engineers, Warrendale, PA, 1999.
Available from the SAE website.
39. Specification for Structural Joints Using ASTM A325 or
A490 Bolts, American Institute of Steel Construction
(AISC), Chicago, IL, 1985.
40.Specification for Structural Steel Buildings Allowable
Stress Design and Plastic Design, American Institute of
Steel Construction (AISC), Chicago, IL, 1989.
Available from the Tech Street Website.
41. Specification for the Design of Cold Formed Steel Structural
Members, American Iron and Steel Institute (AISI),
Washington, DC, 1996.
Available from http://www.steel.org
42. Standard Grading Rules for Canadian Lumber, National
Lumber Grades Authority (NLGA), New Westminster, BC,
Canada, 2003.
Available from http://www.nlga.org/
43. Standard Grading Rules for Northeastern Lumber, Northeastern Lumber Manufacturers Association (NELMA),
Cumberland Center, ME, 2003.
Available from http://www.nelma.org/
44. Standard Grading Rules for Northern and Eastern Lumber,
National Softwood Lumber Bureau (NSLB),
Cumberland Center, ME, 1993.
45. Standard Grading Rules for Southern Pine Lumber, Southern
Pine Inspection Bureau (SPIB), Pensacola, FL, 2002.
Available at http://www.spib.org/about-us/publications
46. Standard Grading Rules for West Coast Lumber, West Coast
Lumber Inspection Bureau (WCLIB), Portland, OR, 2004.
Available from http://www.wclib.org/
47. Standard Specifications for Grades of California Redwood
Lumber, Redwood Inspection Service (RIS), Novato, CA,
2000.
Available at http://www.calredwood.org/
48. Standard Specifications for Highway Bridges, American
Association of State Highway and Transportation Officials
(AASHTO), Washington, DC, 1987.
More recent version is available at http://bookstore.transportation.org/
49. Western Lumber Grading Rules, Western Wood Products
Association (WWPA), Portland, OR, 2005.
Available at http://www.wwpa.org/
50.Design Manual for TECO Timber Connectors Construction,
TECO/Lumberlok, Colliers, WV, 1973.
51. Technical Report 12 General Dowel Equations for Calculating
Lateral Connection Values, American Wood Council (AWC), Washington, DC, 2015.
Available for download.
52. Timber Construction Manual, American Institute of Timber
Construction (AITC), John Wiley & Sons, 2004.
Available at https://www.aitc-glulam.org
53. Wood Handbook: Wood as an Engineering Material, General Technical Report 113, Forest Products Laboratory, U.S.
Department of Agriculture, 1999.
Available at http://www.fpl.fs.fed.us/documnts/fplgtr/fplgtr113/fplgtr113.htm
54. ASTM Standard D 2915-03, Standard Practice for Evaluating
Allowable Properties for Grades of Structural Lumber,
ASTM, West Conshohocken, PA, 2003.
Available at http://www.astm.org/
55. ASTM Standard D 5457-04, Standard Specification for Computing the Reference Resistance of Wood-Based Materials and Structural Connections for load and Resistance Factor Design, ASTM, West Conshohocken, PA, 2004.
Available from http://www.astm.org/
ANSI/ASME Standard B18.2.1-1996, Square and Hex
Bolts and Screws (Inch Series), American Society of Mechanical
Engineers, New York, NY, 1997.
Available from the ASME website.
The provisions for calculating bending deflection in the National Design Specification (NDS®) for Wood Construction Section 3.5 increase the long-term deflection with a creep factor, Kcr. The creep factor ranges from 1.5 – 2.0. These NDS design provisions relate specifically to estimating total deflection including the effects of long-term loading.
The deflection limit for the D+L load combination only applies to the deflection due to the creep component of long-term (dead load) deflection plus the short-term (live load) deflection. For wood structural members that are dry at time of installation and used under dry conditions, the creep component of the long-term deflection can be estimated as the immediate dead load deflection resulting from 0.5D. For wood structural members at all other moisture conditions, the creep component of the long-term deflection is permitted to be estimated as the immediate dead load deflection resulting from D. These assumptions are consistent with the creep component of long-term deflection in the NDS Section 3.5.
Deflection limits for the D+L load combination in IBC Table 1604.3, were taken from the legacy Uniform Building Code (UBC) deflection limits. However, the intent of the UBC limits was not brought forward with the provisions. The original intent of these provisions was to limit the total deflection based on the combination of live load deflection and the creep component of the dead load deflection. As a result, there have been several prior code cycle modifications to these provisions to re-instate the original intent, such as the addition of footnote “g” for steel structural members which effectively excludes steel from checking for the creep component of dead load deflection. As currently written and formatted, the D+L deflection provision can be misinterpreted to suggest that the total deflection due to dead load, D, including both the immediate and creep components of the dead load deflection, should be used with the deflection limit in this column. Additionally, use of 0.5 D in footnote “d” is potentially non-conservative without clarification that the 0.5D load reduction approach is only applicable to calculating theD+L deflection for use with the deflection limits in IBC Table 1604.3. As a result, AWC has submitted a change to Table 1604.3 footnote “d” to clarify these points and to make the 2015 IBC Table 1604.3 provisions consistent with the provisions in NDS 3.5.2 for long-term loading, with the stated intent in the UBC, and with similar provisions in ACI 318 as described in the ACI 318 Commentary.
According to the 2005 NDS in section 3.2.3:
3.2.3.1 Bending members shall not be notched except as permitted by 4.4.3, 5.4.4, 7.4.4, and 8.4.1. A gradual taper cut from the reduced depth of the member to the full depth of the member in lieu of a square cornered notch reduces stress concentrations.
3.2.3.2 The stiffness of a bending member, as determined from its cross section, is practically unaffected by a notch with the follow dimensions:
notch depth = (1/6)(beam depth)
notch length = (1/3)(beam depth)
See 3.4.3 for the effect of notches on shear strength.
Changes from the 1997 NDS to the 2005 NDS include addition of the squared component on the strength reduction term and reformat of the shear question in an “allowable shear” format versus the “actual shear stress” format in the 1997 edition.
Also, see the 1997 NDS Commentary for additional information on changes.
Check out our eCourses for “Designing with the NDS.”
There are no published values for shear capacities perpendicular to grain, however, compression perpendicular to grain design values are tabulated in the NDS supplement.
For more information on shear perpendicular to grain, contact USDA Forest Products Lab.
Review of ASTM procedures used to establish allowable shear stresses revealed that shear values were being reduced by two separate factors for effects of splits, checks, and/or shakes. One of these adjustments was made to the base value, while the other was an adjustment to design values for grade effects. In 2000, ASTM standard D245 was revised to remove one of these adjustments, which resulted in an increase of nearly two for allowable shear design values; however, grade effect adjustments were eliminated.
In the 2001 NDS Supplement, shear design values for sawn lumber are generally 1.95 times higher than values printed in the 1997 edition in response to the change in ASTM D245. With this change, shear-related provisions in the NDS were reevaluated and modified where necessary to provide appropriate designs. Changes include:
- Removal of the shear strength increase factor, CH, which previously permitted shear design values to be increased based on limited occurrences of splits, checks, and shakes.
- Revised provisions for ignoring shear loads near supports.
- Revised provisions for shear strength at notches (where permitted).
- Revised provisions for shear strength at connections less than 5d from member ends.
There is a paper on the AWC website, outlining this change in more detail, at the following link: NDS 2001 Changes Overview
Southern Pine is a US species with design values included in Table 4B of the NDS Supplement. Southern Pine from Argentina is included table 4F of the NDS Supplement. Contact the Southern Pine Inspection Bureau for more information: http://www.spib.org.
No. The published Southern Pine timber values are for wet and dry use. The Southern Pine grade rules, section 164.4 state:
“Where lumber is over 4″ thick, the stress ratings apply without regard to seasoning, and stress ratings as herein indicated for a moisture content over 19% apply also to seasoned lumber if over 4″ thick.”
First check Table 2.1 – List of Sawn Lumber Species Combinations beginning on page 4 of the NDS Supplement. Design values for the species listed in the NDS Supplement are provided by the grading agencies.
The 2005 NDS supplement (and subsequent editions) Table 4F has non-North American visually graded dimension lumber including:
Austrian Spruce—Austria and the Czech Republic
Douglas Fir/European Larch—Austria, Czech Republic, Bavaria (Germany)
Montane Pine—South Africa
Norway Spruce—Estonia, Lithuania, Finland, Germany, NE France, Switzerland, Romania, Ukraine, Sweden
Scots Pine—Austria, Czech Republic, Romania, Ukraine, Estonia, Lithuania, Finland, Germany, Sweden
Silver Fir—Germany, NE France, Switzerland
Southern Pine—Misiones Argentina
As for other foreign species such as mahogany, ipe, greenheart, etc., or domestic species such as ash, locust, magnolia, walnut, etc., there is some design information in the Wood Handbook published by the US Dept of Agriculture Forest Service, which can be found at the FPL website. However, since these values are average unadjusted ultimate values, they need to be adjusted per applicable ASTM standards, such as ASTM D245, to arrive at allowable properties. A further complication is that if lumber is not grade stamped in accordance with American Lumber Standard Committee (ALSC) rules (http://www.alsc.org/), there is no way of knowing what type of product will be used in construction. Engineering judgment will be required to use these types of foreign species in structural applications.
Please contact the supplier for more information.
The short answer to this question is that, in general, engineered wood products and assemblies do not exhibit well-defined plastic characteristics. While some material properties show nonlinear stress-strain behavior (e.g., compression perpendicular to grain) as do many types of dowel-type wood connections, they do not exhibit the extended plastic region exhibited by mild steel. Neither do engineered wood products generally exhibit “transition” failure modes such as those of reinforced concrete (i.e., concrete cracking, load redistribution, etc.). As new engineered wood and non-wood composite products are developed and marketed that DO exhibit well-defined plastic characteristics, we hope to extend some of the classical plastic analysis techniques to these products in our LRFD documents.
Chapter 16 of the National Design Specification (NDS) for Wood Construction provides a code-recognized approach for determining the fire resistance of solid sawn, glulam, and select structural composite lumber (SCL) materials, including laminated veneer lumber (LVL), parallel strand lumber (PSL), laminated strand lumber (LSL), and cross-laminated timber (CLT). Design for Code Acceptance Document 2, titled “Design of Fire-Resistive Exposed Wood Members” (DCA 2) provides resources for users to calculate fire resistance for exposed wood members, in compliance with Chapter 16 of the NDS including flexural members (beams), compression members (columns), and solid lumber including decking and other structural members. Additional information including background, examples, and tables providing allowable load ratios for different member types and sizes can be found in Technical Report 10 (TR10).
See also:
The 2015 National Design Specification for Wood Construction (NDS) Chapter 16 and Technical Report 10 allows for the design of wood members exposed to fire.
Carriage bolts (now known as round head bolts) do not conform to ANSI/ASME B18.2.1 Square and Hex Bolts and Screws, so the installation provisions in 2015 NDS 12.1.3.1 (2012 NDS 11.1.3.1) do not apply. Also, carriage bolt dimensions do not comply with the dimensions in ANSI/ASME B18.2.1, therefore, NDS tabulated values do not apply. However, the use of carriage bolts is permissible in accordance with 2015 NDS 11.1.1.3 (2012 NDS 10.1.1.3) provided that characteristics of the carriage bolt are accounted for in connection design and installation. These characteristics include carriage bolt material, bending yield strength (Fyb), diameter, and the potential presence of a square neck under the head in lateral calculations and installation instructions. ASME B18.5-2012 Round Head Bolts provides standard dimensions as shown in Tables 1 and 2 for round head and round head square neck bolts, respectively.
Tables 1 and 2 reprinted from ASME B18.5-2012 Round Head Bolts (Inch Series), by permission of The American Society of Mechanical Engineers. All rights reserved.
The 2018 National Design Specification® (NDS®) for Wood Construction is the first edition to specifically address the withdrawal strength of smooth shank stainless steel nails. The new stainless steel nail withdrawal equation produces lower values of withdrawal strength than the NDS steel wire nail equation based on tests of smooth shank carbon steel wire nails. The reduction in withdrawal strength, due to the reduced friction provided by stainless steel, varies 5% to 40% over a common range of wood-specific gravity with the greatest reduction associated with high-specific-gravity wood.
AWC has links to historic documents on our website here: NDS Archives
Designers can view and download copies of the 1922 Design Values for Structural Timber and the 1944 NDS on this page. Archive versions of the NDS are also available for a small fee.
Ecourses are also available relating to evaluating in-service structures. Both DES140 – Structural Condition Assessment of In-Service Wood and DES160 – Evaluation of Recommended Allowable Design Properties for Wood in Existing Structures can provide helpful information to professionals working with existing structures.
See also General FAQ, “Where can I find information on evaluation, maintenance, and repair of existing structures?”
The sections of the IBC and IRC that deal with sound transmission are IBC Section 1206 and IRC Appendix AK. These code provisions apply to wall and floor/ceiling assemblies separating dwelling units from other dwelling units, or from adjacent public areas, within a building. These provisions do not deal with sound transmission from outdoors to indoors, through an exterior wall. Although US model building codes do not contain provisions regulating minimum sound transmission performance of exterior walls, there are some cases where designers specify a minimum level of sound transmission performance for exterior walls on specific construction projects. In such cases, the most direct and accurate way of assessing sound transmission performance of an exterior wall is through field testing in accordance with ASTM E966 and analysis in accordance with ASTM E1332. The single-number ratings resulting from this test and analysis procedure are outdoor-indoor transmission class (OITC) and outdoor-indoor noise isolation class (OINIC(θ)). Conversely, sound transmission class (STC) is determined through laboratory testing in accordance with ASTM E90 and analysis in accordance with ASTM E413. This testing and analysis is most commonly used for assessing the sound transmission performance of interior walls and floor/ceiling assemblies separating dwelling units from other parts of a building, as these are the only places where US model building codes require minimum sound transmission performance. While it is possible to perform an ASTM E90 test on an exterior wall assembly in a laboratory and determine an STC rating for that assembly using ASTM E413, this is less commonly done because building codes do not place minimum performance requirements on sound transmission through exterior wall assemblies and because OITC and OINIC(θ) ratings provide in-situ assessments of exterior wall performance.
As stated in Section 1.1 of ASTM E90, the scope of this standard is limited to building partitions such as walls, operable partitions, floor-ceiling assemblies, doors, windows, roofs, etc. Although it is possible to use ASTM E90 to assess the sound transmission performance of individual components that would be used within an assembly, such use is not within the scope of the standard and is typically only done for the purpose of research. Furthermore, sound transmission class (STC) values derived for individual components of an assembly are not necessarily additive. In other words “component-additive methods” (CAM) do not necessarily yield accurate estimates of sound transmission through a complete assembly. This is especially the case when dealing with assemblies that have a cavity or void through the thickness (e.g., a stud wall with cavities between the studs). That said, there are other models (besides CAM) for estimating sound transmission performance that yield more accurate results. For example, AWC’s Technical Report 15 (TR15) provides models that can be used to estimate STC and impact-insulation class (IIC) ratings for light-frame floor/ceiling assemblies (https://awc.org/publications/tr-15-calculation-of-sound-transmission-parameters-for-wood-framed-assemblies).
2012 International Residential Code (IRC) States:
R501.3 Fire protection of floors. Floor assemblies, not required elsewhere in this code to be fire resistance rated, shall be provided with a ½ inch gypsum wallboard membrane, 5/8 inch wood structural panel membrane, or equivalent on the underside of the floor framing member.
Exceptions:
- Floor assemblies located directly over a space protected by an automatic sprinkler system in accordance with Section P2904, NFPA13D, or other approved equivalent sprinkler system. (AWC has developed a guide for partial sprinklering of unfinished basement areas.)
- Floor assemblies located directly over a crawl space not intended for storage or fuel-fired appliances.
- Portions of floor assemblies can be unprotected when complying with the following:3.1 The aggregate area of the unprotected portions shall not exceed 80 square feet per story.
3.2 Fire blocking in accordance with Section R302.11.1 shall be installed along the perimeter of the unprotected portion to separate the unprotected portion from the remainder of the floor assembly.
- Wood floor assemblies using dimension lumber or structural composite lumber equal to or greater than 2-inch by 10-inch nominal dimension, or other approved floor assemblies demonstrating equivalent fire performance.
The genesis for this requirement was five separate code change proposals introduced in 2009 to revise IRC. The IRC Code Development Committee disapproved all the proposals and requested that the interested parties work together to develop a public comment. In October 2010, the ICC membership approved the above text, jointly developed by the International Association of Fire Fighters, International Association of Fire Chiefs-Life Safety Section, the National Association of Home Builders, and the American Wood Council.
Q: Do I have to specially fire block the perimeter of the opening between the permitted 80 ft² unprotected area and the balance of the protected area?
A: Recent testing with an 80 ft² unprotected area has shown that if a fire occurred under a protected area, fire blocking would provide a minimal level of performance of the membrane system. This affirms the proponents’ intent that the perimeter between the 80 ft² unprotected area and the protected area needs to be fire blocked and no special treatment beyond the specified fire blocking is necessary to achieve the desired performance.
Q: Do I have to treat the joints in the gypsum wallboard with tape and compound?
A: Gypsum wallboard joints are not required to be finished with tape and joint compound. A somewhat analogous requirement in the code is a thermal barrier over foam plastic insulation. Such barriers are also not required to be finished with tape and joint compound. Likewise joints between wood structural panels are not required to be finished with wood filler and sanded.
Q: What was the intent when Clause R501.3, Exception 4 (R302.13 in the 2015 IRC) was developed?
A: As one of the original proponents of this language, AWC has insight into the intent and discussions leading to development of the wording in this exception.
To be considered equivalent to 2×10 sawn lumber or SCL, the framing members should support a load corresponding to 50% of the full bending design of the framing members, while being subjected to an ASTM E 119 time/temperature heating regime. All components utilized in the manufacture of the framing members (fasteners, plates, hardware, etc) should be utilized during testing. The test end criteria should be structural member failure.
AWC believes that the most straightforward and accurate means of determining the required minimum fire resistance time would be to estimate that time using the calculation methodology specified in NDS Chapter 16 for unprotected solid-sawn 2×10 floor joists assuming: a 3-sided exposure, a nominal char rate of 1.5 inches/hr, a bending strength to ASD ratio of 2.85, and supporting a load corresponding to 50% of full bending design.
Q: Do trusses of 2 inch nominal by 10 inch nominal dimension fall within the intent of Exception 4 to Section 501.3 in the 2012 IRC?
A: No. The International Code Council has issued an advisory opinion that Exception 4 does not apply to trusses. Further, the supporting information submitted with the original code change proposal for this section identified where basic membrane protection was to be required and specifically cited unprotected floor/ceiling assemblies using trusses, I-joists, cold formed steel members, and bar joists as structural members needing to meet the membrane requirements. Additionally, the ICC advisory opinion states that assemblies using wood trusses may be approved for exemption if the floor assembly demonstrates equivalent fire performance to floor assemblies using 2×10 lumber. While not noted in the ICC advisory opinion, any other framing system may be approved under Exception 4 by demonstrating equivalent fire performance to floor assemblies using 2×10 lumber.
Some have interpreted the International Residential Code (IRC) to require continuous headers across multiple spans in order for the building to comply with the IRC wall bracing requirements. This application is mostly seen when there are multiple garage door openings. Some might assume that a continuous header will make the entire front wall of the garage stronger, or believe that Figures 602.10.6.2 through 602.10.6.4 require that the headers be continuous across multiple openings, extending from portal frame to portal frame. However, a continuous header is subject to buckling at intermediate walls or columns unless the walls or columns are laterally braced to prevent the wall and header from buckling. Therefore, in the case of multiple garage door openings, two or more single span headers connected to a portal frame on one end and full height studs at the other (at the intermediate wall or column) is recommended. IRC Figures 602.10.6.2 through 602.10.6.4 are confusing and can be easily misunderstood. The intent is that, for a single portal frame condition, the single span header is connected to the portal frame at one end and supported by an intermediate wall with full-height studs at the other end. For a double portal frame condition, the single span header is connected to a portal frame at each end. The figures are not detailed for a continuous header across multiple openings. In fact, continuous headers over multiple openings should not be permitted unless designed in accordance with accepted engineering practice.
Anchorage of wood sill plates and wood wall sole plates are called out in Section R403.1.6 of the IRC, requiring ½-inch anchor bolts embedded 7 inches into concrete or grouted cells of masonry and spaced at no more than 6 feet on center. A minimum of two anchor bolts are required in each plate and an anchor bolt is required within 12 inches but not closer than 7 bolt diameters from each plate end. Although nuts and washers are required to be installed, there are no minimum requirements. However, for braced wall lines in Seismic Design Categories D0, D1 and D2 and for townhouses in Category C, larger 3” x 3” plate washers are required for use with the anchor bolts (see Section R602.11.1) installed in accordance with R403.1.6.1. The use of the larger plate washers is one simple and cost-effective method to design braced wall panels with increased load capacity for uplift and lateral loads from wind and/or seismic events which may be incorporated into the design of braced wall panels in other geographic regions as well. Remember that anchorage is only as good as the weakest link in the continuous load path to the foundation, which may include continuous sheathing, hurricane clips, hold downs, strapping for floor-to-floor connections, and other components.
No. In the southeastern U.S. where the ultimate design wind speeds are 130 mph or less (and in other areas where the ultimate design wind speeds are less than 140 mph), framing provisions for wall studs and plates and fastening schedules in IRC Section R602 are independent of the lumber species and assigned specific gravity; therefore, these wall framing provisions are not limited to the four species groups tabulated in the IRC for headers, joists, and rafters. In areas where the ultimate design wind speeds are greater than these thresholds, the wind provisions in the IRC do not apply, and the user is directed to design the structure in accordance with one or more of the following methods:
- ICC’s International Building Code (IBC).
- ASCE’s Minimum Design Loads for Buildings and Other Structures (ASCE 7), which for wood construction would be used with AWC’s National Design Specification (NDS) for Wood Construction and AWC’s Special Design Provisions for Wind and Seismic.
- AWC’s Wood-Frame Construction Manual for One- and Two-Family Dwellings (WFCM).
- ICC’s Standard for Residential Construction in High-Wind Regions (ICC 600).
Even in noncombustible construction types (Types I and II), many elements of the building, such as floor coverings, windows and doors, interior finishes, and roof structures can be wood. Permitted combustible building elements in noncombustible buildings are conveniently listed in Section 603 of the IBC. This list also includes structural elements that are constructed of fire retardant treated wood (FRTW) or heavy timber. Although FRTW is not considered noncombustible by the building code definition, it is often permitted to be used in place of noncombustible materials. For instance, FRTW can be used in place of noncombustible materials in exterior walls of Type III and IV buildings, and in roof structures of low-rise buildings of Types I and II construction. Untreated heavy timber can be used for roof structures of Types I and II buildings where the required rating does not exceed 1 hour.
See Chart in this PDF Document
Most rail systems are hardwoods and need a different set of design values (Note that most of the hardwoods used typically do not have a grade stamp, they would have to be graded in some way to determine design values, assuming they are in the NDS Supplement). Furthermore, no criteria for deflection exists for this application. The test criteria are commonly interpreted to mean ultimate load at failure.
The provisions for calculating bending deflection in the National Design Specification (NDS®) for Wood Construction Section 3.5 increase the long-term deflection with a creep factor, Kcr. The creep factor ranges from 1.5-2.0. These NDS design provisions relate specifically to estimating total deflection including the effects of long-term loading.
The deflection limit for the D+L load combination only applies to the deflection due to the creep component of long-term (dead load) deflection plus the short-term (live load) deflection. For wood structural members that are dry at time of installation and used under dry conditions, the creep component of the long-term deflection can be estimated as the immediate dead load deflection resulting from 0.5D. For wood structural members at all other moisture conditions, the creep component of the long-term deflection is permitted to be estimated as the immediate dead load deflection resulting from D. These assumptions are consistent with the creep component of long-term deflection in NDS Section 3.5.
Deflection limits for the D+L load combination in IBC Table 1604.3 were taken from the legacy Uniform Building Code (UBC) deflection limits. However, the intent of the UBC limits was not brought forward with the provisions. The original intent of these provisions was to limit the total deflection based on the combination of live load deflection and the creep component of the dead load deflection. As a result, there have been several prior code cycle modifications to these provisions to reinstate the original intent, such as the addition of Footnote G for steel structural members which effectively excludes steel from checking for the creep component of dead load deflection. As currently written and formatted, the D+L deflection provision can be misinterpreted to suggest that the total deflection due to dead load, D, including both the immediate and creep components of the dead load deflection, should be used with the deflection limit in this column. Additionally, the use of 0.5D in Footnote D is potentially non-conservative without clarification that the 0.5D load reduction approach is only applicable to calculating the D+L deflection for use with the deflection limits in IBC Table 1604.3. As a result, AWC has submitted a change to Table 1604.3 Footnote D to clarify these points and to make the 2015 IBC Table 1604.3 provisions consistent with the provisions in NDS 3.5.2 for long-term loading, with the stated intent in the UBC, and with similar provisions in ACI 318 as described in the ACI 318 Commentary.
We didn’t find any discussion in any of the codes we’ve referenced. Nothing either allowed or disallowed. The prevalence of surviving historical structures suggest these may be viable.
*********
The 2003 International Building Code (IBC) does not define seismic design coefficients for timber braced frames or three hinged arches. The only U.S. code source for this type of information is the 1997 Uniform Building Code (UBC). 1997 UBC Table 16-9 provides design coefficients for building frames and bearing wall systems. For braced frames in bearing wall systems (where frames are carrying gravity load as well as lateral load) reduced R factors are assigned. For heavy timber braced frames in 1997 UBC, R = 2.8 is assigned. For drift, Eq. 30-17 is applicable with the value of 0.7R being analogous to IBC’s Cd factor.
There are many applications for fire-retardant-treated wood (FRTW) in the International Building Code (IBC). The 2015 IBC defines FRTW in Chapter 2 as “Wood products that, when impregnated with chemicals by a pressure process or other means during manufacture, exhibit reduced surface-burning characteristics and resist propagation of fire.” Section 2303.2 sets the performance requirements for FRTW, including achieving a listed flame spread index of 25 or less, when tested to ASTM E84 or UL 723; no evidence of progressive combustion when the test is continued for an additional 20-minute period; and, the flame front not progressing more than 10.5 feet from the center of the burners at any time during the test.
Recently, there have been questions as to whether painted, coated, and other surface-treated wood products that may meet the flame spread testing criteria can be approved as FRTW, given the requirement for chemical impregnation of the wood. The short answer is that surface-coated wood products which do not have fire-retardant chemicals impregnated into the wood itself do not meet the strict IBC definition of FRTW, irrespective of meeting the flame spread requirements. However, surface-coated wood products can be approved for use in applications where FRTW is permitted, through the code’s alternative materials, design, and methods provisions found in Section 104.11, if appropriate testing and evaluation is conducted that establishes performance equivalency to FRTW.
What are these alternative provisions and on what basis can code officials approve surface-coated wood products? Section 104.11 of the IBC gives the code official authority to approve any alternative determined to be “satisfactory and complies with the intent of the code,” and is “not less than equivalent to what is prescribed in the code for quality, strength, effectiveness, fire resistance, durability, and safety.” One resource used by code officials to help in making this decision is the International Code Council Evaluation Services (ICC-ES), an independent subsidiary of ICC that provides technical evaluations of building products. ICC-ES relies on published acceptance criteria developed in open hearings and approved by the ICC-ES Evaluation Committee. This criteria provides a technical benchmark by which alternative products seeking to enter the marketplace may be evaluated. ICC-ES Acceptance Criteria is currently available for wood products with surface treatments intended to substitute for FRTW, including ICC-ES AC47, AC124, AC264, and AC479. These approved Acceptance Criteria require evaluation of surface burning characteristics of the product, durability and corrosivity of treatments, and effects of treatments on strength or stiffness of the wood substrate. Durability considerations, for example, help to ensure that the surface burning characteristics of the applied treatment remain effective after exposure to weather such as soak-freeze-thaw cycles or alternating UV/rain exposure. Code officials can use the resulting ICC-ES evaluation reports to approve and accept use of products in accordance with the conditions and requirements of the reports.
In the ICC code change cycle for the 2018 edition of the International Building Code (IBC), a clarification was approved for Section 2303.2.2. The intent of the code change is explained below by showing the change as originally proposed (S262-16) and the final approved change as modified by the committee.
Summary of Change to 2303.2.2 in 2018 Edition of IBC per S262-16
Change as originally proposed:
2303.2.2 Other means during manufacture. For wood products impregnated with chemicals by other means during manufacture, the treatment shall be an integral part of the manufacturing process of the wood product. The treatment shall provide permanent protection to all surfaces of the wood product. The use of paints, coatings, stains or other surface treatments shall not be permitted.
Final approved change as modified by the committee:
2303.2.2 Other means during manufacture. For wood products impregnated with chemicals by other means during manufacture, the treatment shall be an integral part of the manufacturing process of the wood product. The treatment shall provide permanent protection to all surfaces of the wood product. The use of paints, coatings, stains or other surface treatment are not an approved method of protection as required in this section.
Full committee reason in support of the final approved change as modified by the committee:
“This code change adds a necessary clarification to the use of surface treatments for wood. The modification makes the use of such materials possible as an alternate method.”
(S262-16 was approved as modified by the committee. For the ICC full documentation, see http://media.iccsafe.org/codes/2015-2017/GroupB/PCH/IBC-S.pdf and http://media.iccsafe.org/codes/2015-2017/GroupB/CAH/2016-Report-CAH.pdf.)
The approved modifications to 2303.2.2 clarify that the “other means during manufacture” subsection is not intended to permit surface-protected products as outright replacements for fire retardant treated wood (FRTW), given the requirement for chemical impregnation into the wood. The committee reason states: “This code change adds a necessary clarification to the use of surface treatments for wood.”
Importantly, though, the code development committee’s modifications to the original proposed change also preclude interpreting 2303.2.2 as an outright ban or prohibition on surface-coated products. The committee reason further states: “The modification makes the use of such materials possible as an alternate method.”
As has been the case for some time, wood products protected by surface treatments can be evaluated and approved by using the provisions of IBC 104.11 (See also Codes & Standards FAQ, “Can Surface-Coated Wood Products be Approved for Use in Applications Where Fire-Retardant-Treated Wood is Permitted?”).
Full Question:
What is the background behind footnote “m” of IBC 2012 table 721.1 (2) which states:
“m For studs with a slenderness ratio, le/d, greater than 33, the design stress shall be reduced to 78 percent of allowable F′c. For studs with a slenderness ratio, le/d, not exceeding 33, the design stress shall be reduced to 78 percent of the adjusted stress F′c calculated for studs having a slenderness ratio le/d of 33.”
Answer:
Most North American fire tests on wood stud wall assemblies were conducted between 1950 and 1975. During that time, the standard wall configuration was a 10 foot x 10 foot wall using 2×4 Select Structural grade Douglas Fir-Larch or 2×4 #1 Dense grade Southern Pine studs. These grades were chosen to allow a single, highly-loaded test to be used for all lower grade studs.
In 1982, the design values for compression perpendicular-to-grain stress (Fc-perp) were increased due to changes made to ASTM D245 Standard Practice for Establishing Structural Grades and Related Allowable Properties for Visually Graded Lumber. D245 provisions were changed so that reference Fc-perp design values were derived from Fc-perp test results at 0.04″ deformation rather than at proportional limit which had previously been used. Because of this change, designs which had previously been limited by Fc-perp, such as bearing wall assemblies, were then limited by other criteria.
The National Forest Products Association (NFPA) staff was asked if the wall assembly fire resistance tests conducted between 1950 and 1975 were valid since the loads on the walls were now often limited by the calculated buckling stress, FcE, rather than the calculated bearing. Recognizing that the fire resistance of an assembly under a given load would not change just because the reference basis of the design value had been changed, the maximum calculated load capacity of the assembly using the old and new criteria were calculated and compared based on the 1982 design values for Fc-perp.
Using the Fc-perp design values which have been in place since 1982, the calculated load capacity of 2×4 wall assemblies are typically limited by column buckling in the strong axis direction. Several design assumptions were resolved for the final comparison. First, the actual stud length for a 10 foot wall was assumed to be 115.5 inches (120-3*1.5). Also, since it was unclear which grades of lumber were used in the fire tests, staff compared Select Structural, #1, #2 and #3 grades and found that the most conservative assumption was to use design values for Select Structural for the comparisons.
Most wall assembly tests that are the basis of the 1 and 2-hour wood wall assemblies in the International Building Code (IBC) were 10′ walls using 2×4 studs. From the above calculation, it was valid (though conservative) to limit the capacity of those wall assemblies to 78% of the adjusted allowable compression design value at a Le/d ratio of 33. Since 1999, AWC has conducted multiple wall assembly tests that permit the use of 2×4 and 2×6 wall assemblies at full design load (100% of designs per the 2005 National Design Specification (NDS) and later versions). These assemblies have been included in the IBC and are described in DCA3.
Among the changes approved in the current code change cycle was G109-18, which will, for the first time, allow concealed spaces in traditional Type IV heavy timber buildings. The concealed spaces must be protected with one or more of the following three alternatives:
- the building is sprinklered throughout and sprinkler protection is provided in the concealed space,
- surfaces in the concealed space are fully sheathed with 5/8-inch Type X gypsum board, or
- the concealed space is filled completely with noncombustible insulation.
There is an exception for stud spaces in framed one-hour interior walls and partitions, which are permitted in Type IV-HT construction.
These same provisions have often been accepted by code officials through alternate methods as necessary protection for concealed spaces in traditional Type IV construction. The 2021 edition of the IBC will have a code path for acceptance without resorting to the alternative methods and materials section of the code. This should greatly help in the rehabilitation of many existing heavy timber buildings that are being put back into use as new occupancies and will allow new construction of Type IV-HT with concealed spaces that are commonly found in residential occupancy groups where ceilings may conceal overhead plumbing and mechanicals.
The 2021 International Building Code will require a Site Safety Director, employed by the building owner, to conduct and document daily construction fire safety inspections. This is only one of several new requirements approved in F263-18 and F264-18 for buildings under construction. According to the new requirements, the fire official is authorized to issue a stop work order upon repeated omissions in inspection and/or documentation of the following:
- the training qualifications of hot work contractors admitted to the site (must have received training in the hot work safety requirements of IFC Chapter 35)
- observing that hot work is performed only in pre-approved locations
- safety of temporary heating equipment
- removal of trash and debris
- safety of temporary wiring
- safe storage of flammable liquids and hazardous materials
- openness of fire access roads
- fire hydrant visibility and access
- availability of operating standpipes as construction progresses
- fire extinguisher placement
The National Fire Protection Association reports that for a five-year period from 2010 through 2014, fires at sites undergoing construction, major renovation, and demolition averaged 17% of annual fire department structure fire responses and 3.2% of annual fire losses in the U.S. For more information see https://constructionfiresafety.org/.
Footnote “c” of IBC Table 601 permits heavy timber for roof construction in all construction types except Type I-A when the required fire resistance is one hour or less. But what if a roof member is also part of the primary structural frame of the building, which is governed by a separate row of Table 601? A code change was approved in the last ICC code change cycle, G102-18, which makes it clear that footnote “c” applies even if the roof member is a part of the primary structural frame. The footnote in the 2021 IBC will read “In all occupancies, heavy timber complying with Section 2304.11 shall be allowed for roof construction, including primary structural frame members, where a 1-hour or less fire-resistance rating is required.”
Code provisions on this point have flip-flopped in recent years. The 2012 IBC limited projections to no less than 2 feet from the property line if the fire separation distance (FSD, usually the distance from the exterior wall to the property line) was less than 5 feet, or no less than 40 inches to the property line when the fire separation distance was 5 feet or greater. The 2015 IBC took a detour and set the minimum projection distance at “24 inches plus 8 inches for every foot of FSD beyond 3 feet or fraction thereof” beginning at an FSD of 3 feet, which resulted in much greater restrictions. Then, the 2018 IBC dropped this formula and went back to the 40-inch limit when the building had an FSD of at least 5 feet but kept the formula for buildings with an FSD between 3 feet and less than 5 feet. And most recently, a 2021 IBC change will strike the “old” formula for buildings with an FSD from 3 to less than 5 feet and will replace it with “2/3 the FSD” (see ICC code change FS14-18).
Bottom line? The 2021 IBC will be only slightly more restrictive on the proximity of commercial building projections to the property line than the 2012 IBC, and only for buildings with an FSD from 3 to less than 5 feet. Keep in mind that combustible projections extending to within 5 feet of the property line must be of 1-hour construction, heavy timber, or fire-retardant-treated wood. There’s an exception to this for Type V-B construction with an FSD of at least 5 feet (see 705.2.3 of the 2018 IBC).
Attic fires can be a significant hazard in residential mid-rise structures. The 2018 IBC has provisions for increased attic protection based on the height of the building. For wood construction, when the roof assembly exceeds 55 feet above the lowest level of required fire department vehicle access, the attic must be protected by sprinklers or alternative protection must be provided. This means that certain special occupancy “pedestal” buildings must have sprinkler-protected attics even if they could have an NFPA 13R sprinkler system (as opposed to a full NFPA 13 system). See subsection 903.3.1.2.3 Attics in the 2018 IBC for the full requirements.
A reminder: sprinklers do no good if a fire begins before sprinklers are operational. See the Construction Fire Safety Coalition website for resources on preventing construction fires: www.constructionfiresafety.org
Section 704.2 of the 2018 International Building Code (IBC) was revised from its origin which began in the legacy building codes and was primarily intended to address steel construction. In earlier editions of the IBC, omission of fireproofing on portions of steel columns or beams behind ceiling or wall membranes of fire-resistance-rated assemblies was permitted. During more recent code development cycles, it was agreed that membrane protection alone was inadequate, especially for members carrying the upper floors of a building, since they could be exposed to fire which originates in a concealed space or from fire in a room if the membrane protection fails. Because steel has no inherent fire resistance (steel can yield quickly at temperatures commonly occurring in fires), the method and location of the protection is considered critical.
The 2018 IBC was revised to clearly indicate that columns as well as studs and boundary elements in walls of light-frame construction and are located entirely between the top and bottom plates are permitted to have their required fire resistance ratings provided by the membrane protection for the wall. Elements within fire-resistance-rated walls of light-frame construction are addressed directly in IBC Section 704.4.1 (Light-frame Construction) and can be part of a fire-resistance-rated wall assembly without any additional fire protection. Many buildings are built out of typical light frame construction; the concentrated loads from trusses or beams must have a continuous load path to the foundation. Previously, some jurisdictions were interpreting that these construction elements were considered primary structural columns and requiring them to be provided with individual fire protection. It was never the intent to require individual fire protection of these elements as they are not considered a portion of the primary structural frame.
IBC Section 202 defines the Primary Structural Frame as the Columns; Structural Members, Floor Construction and Roof Construction (all having direct connections to the columns); and Bracing members essential to the vertical stability of the primary structural frame under gravity loading. IBC Section 704.2 requires all columns, that are required to be protected, to be protected with individual encasement protection throughout the entire column length. This section clarifies that columns extending up through the ceiling must extend the required encasement protection from the foundation to the beam above.
By definition, a light-frame construction wall is primarily built with repetitive studs. When braced by sheathing or gypsum board attached to the wall framing, the design of studs, multiple studs, or posts is similar based on the L/d for the member buckling out of the plane of the wall. Perpendicular to grain bearing of the studs on the top and bottom plates is also a consideration and is the same regardless of whether the studs are spaced, studpacks, or posts. The structural design of all of these members is considered column design. In previous editions of the IBC or legacy codes an issue sometimes occurred when studs, multiple studs, or solid sawn members were framed integrally within a fire-resistance-rated light frame wall and were treated as columns according to the definition of primary structural frame, and were then required to be provided with individual encasement protection.
The intent of Sections 704.2 and 704.4.1 have been clarified in the 2018 IBC to state studs, boundary elements, posts, multiple stud groups, built-up columns, and solid columns that are framed within the wall and do not penetrate the top or bottom plates are all designed to the same criteria and shall be considered integral elements. These elements that are integral within the confines of the load bearing wall, and do not penetrate the top or bottom plates, are permitted to be protected in light frame construction by the membrane protection of the fire-resistance-rated bearing wall.
What is the correct application of 2018 IBC Section 704.3 (Protection of the primary structural frame other than columns) to wood construction?
Definitions for “primary structural frame” and “light-frame construction” are included in IBC Chapter 2. IBC Section 704.3 (Protection of the primary structural frame other than columns) is for systems that meet the definition of “primary structural frame,” but not heavy timber or light-frame construction. Floor joists, ceiling joists, and rafters in light-frame construction do not fall within the definition of primary structural frame. Likewise, wood beams, if required to be rated, (Type IIIA or VA building) are typically part of a light-frame system. Their fire resistance would be established by normal means, whether calculating fire resistance as an exposed wood member or protecting with other materials. As for Type IV, Table 601 requires no fire resistance rating for structural elements, as long as they meet the minimum required dimensions for Type IV construction as specified in IBC Section 2304.11.sf.
Fall ’04 ed. of Wood Design Focus, “Considerations for Mortise and Tenon Joint Design.” For more information, visit http://www.forestprod.org/
3/97 edition of the Journal of Structural Engineering, “Characterization of Bearing Strength Factors in Pegged Timber Connections” (p.326-332). Available at http://www.asce.org/
Winter ’92 edition of Wood Design Focus, “Assessing Capacities of Traditional Timber Connections” (p.17-21). For more information, visit http://www.forestprod.org/
A procedure for wood dowel connections has been drafted into the ICC 400 Log Structures Standard. It’s based on work by Dr. Dick Schmidt at the University of Wyoming.
Contact:
Richard Schmidt
Fire Tower Engineered Timber
http://ftet.com/index.php?action=aboutus.contactus
http://www.iccsafe.org/is-log/
Other Resources:
- 2018 TFEC Code of Standard Practice
- Design Considerations for Mortise and Tenon Connections, University of Wyoming April 1999: http://www.timberframeengineeringcouncil.org/images/pdf/joint_report.pdf
- Capacity of Pegged Mortise and Tenon Joints, University of Wyoming February 2004: http://www.ftet.biz/userimages/miller_report.pdf
- Timber Pegs Considerations for Mortise and Tenon Joint Design – Structure Magazine March 2006: http://www.structuremag.org/wp-content/uploads/2014/09/SF-Timber-Pegs-March-061.pdf
Anchor strength provisions in Appendix D of American Concrete Institute (ACI) Building Code Requirements for Structural Concrete, ACI 318, establish “non-ductile” anchor design capacities that are approximately 1/3 of that historically used for 2×4 and 3×4 wood sill plates loaded parallel to the edge of the concrete. Test results show that ductile yielding in accordance with the National Design Specification® (NDS®) for Wood Construction Mode IIIs or Mode IV is consistently achieved prior to concrete failure. While ductile connections are assigned increased design capacities in ACI 318, the bending yield behavior of dowels in wood connections is not specifically recognized.
With assistance from AWC, a report on anchor bolts connecting wood sill plates to concrete with edge distances typically found in wood frame construction is complete and available.
International Staple & Nail Tool Association
512 W. Burlington Ave., Suite 203
LaGrange, IL 60525
Phone: (708) 482-8138
Fax: (708) 482-8186
Website: http://www.isanta.org
- 2005 National Design Specification for Wood Construction – American Wood Council
- 2012 National Design Specification for Wood Construction – American Wood Council
- Timber Rivet Connections – Design Process for a Hanger Connection – Forest Products Society
- Timber rivets in structural composite lumber – USDA Forest Products Laboratory
- Simplified analysis of timber rivet connections – USDA Forest Products Laboratory
- Timber rivet connections in U.S. domestic species – USDA Forest Products Laboratory
- Timber Rivets – NCSEA/CASE/SEI Structure Magazine
Where can I find suppliers of timber rivets?
Suppliers for timber rivets include:
Fastener Corrosion
Background
Starting January 1, 2004, Chromated Copper Arsenate (CCA) treated wood products were no longer permitted to be manufactured for general sale, with only some minor exceptions for use in limited, well-defined applications. (See https://www.epa.gov/ingredients-used-pesticide-products/chromated-arsenicals-cca
for more information.). Some of the commonly available preservative-treated wood products will be treated with ammoniacal copper quat (ACQ), copper azole (CBA/CA-B), or ammoniacal copper zinc arsenate (ACZA). While these alternative treating chemicals have been proven to be effective wood preservatives when used in accordance with AWPA standards, there is some evidence that these chemicals are more corrosive than CCA to metal fasteners and connectors.
The purpose of this document is to provide answers to some specific questions related to this issue. Users are cautioned that this information is only a synthesis of reports currently available from public sources. A number of sources are attempting to assess the corrosivity of treatment chemicals. Updates will be issued as new or additional information becomes available.
Questions and Answers
Q: Lumber treated with CCA has been available for many years. Does metal corrode in contact with CCA-treated lumber?
The chemicals used in CCA-treated lumber have been shown to be somewhat corrosive to fasteners and connectors. Accordingly, chemical manufacturers and the treated lumber industry have traditionally recommended and the model building codes have required the use of corrosion-resistant fasteners and connectors when used with CCA-treated lumber.
Q: What’s different with the new alternative treatments?
When subjected to standardized laboratory tests that accelerate the corrosion process, metal connectors and fasteners exposed to the chemicals used in ACQ, Copper Azole, or ACZA exhibit higher rates of corrosion than connectors and fasteners exposed to CCA. Discussions within the affected industries are attempting to sort out the significance of these differences in real-world applications.
Q: What should users do while the technical issues are being evaluated?
At the very least, users should rigorously apply the recommendations of the chemical manufacturers and the treating industry—to use corrosion-resistant fasteners and connectors or zinccoated (galvanized) fasteners and connectors with corrosion protection at least equivalent to that of hot-dip galvanized products.
Q: What zinc coating specifications apply to hot-dip galvanized products used in wood building construction?
Specifications for sheet metal connectors (joist hangers and metal straps) and fasteners (such as nails and bolts) are addressed in separate ASTM standards. Coating weight designations for sheet steel are specified in ASTM A 653, Standard Specification for Steel Sheet, Zinc-Coated (Galvanized) or Zinc-Iron Alloy-Coated (Galvannealed) by the Hot-Dip Process. An example zinc coating designation in ASTM A 653 is G185 where “G” indicates zinc coating and “185” indicates a total of 1.85 oz/ft2 of coating on both sides of the steel sheet. For fasteners, minimum coating weights are specified in ASTM A 153, Standard Specification for Zinc Coating (Hot-Dip) on Iron and Steel Hardware. A Class D designation applies for fasteners 3/8” in diameter and smaller. The minimum coating weight associated with Class D is 1.0 oz/ft2.
Q: Is there a difference between “hot-dip” galvanized products and other types of galvanized products manufactured using a different process?
There are a variety of processes for galvanizing metal products other than the hot-dip process. These include electrolysis (electrogalvanized, zinc plated) and peening (mechanical plating). There are some differences and issues that users should be aware of:
Coating thicknesses developed by the electrolysis process may be too thin. Most commonly available electrogalvanized or zinc-plated fasteners and connectors do not have a sufficient coating of zinc for these new chemicals.
The density of the coating can be less than provided by the hot-dip process. For example, mechanically deposited coating in accordance with ASTM B 695 Standard Specification for Coatings of Zinc Mechanically Deposited on Iron and Steel has a density that is approximately 75% of the density of the zinc coating resulting from the hot-dip process. Approximately 33% greater coating thickness is needed to produce the same level of zinc per unit area as provided by the hot-dip process.
Q: What connectors provide maximum corrosion resistance?
Type 304 and 316 stainless steel have been used to provide maximum corrosion resistance. Type 304 and 316 stainless steel connectors and fasteners have been used in demanding applications such as coastal exposures and in permanent wood foundations.
Q: What other details should users and specifiers be aware of?
There are other issues that have been reported that are important to users:
Never mix galvanized steel with stainless steel in the same connection. When these dissimilar metals are in physical contact with each other, galvanic action will increase the corrosion rate of the galvanized part (the zinc will migrate off the galvanized part onto the stainless part at a faster rate).
Galvanizing provides a sacrificial layer to protect the steel connector or fastener. Greater thicknesses (coating weights—see Table 1) generally provide longer protection in corrosive environments.
Aluminum should not be used in direct contact with CCA, ACQ, Copper Azole, or ACZA.
Q: Are all alternative treatments more corrosive than CCA?
The majority of the research has been conducted on the corrosivity of ACQ and Copper Azole. Comparative testing has indicated that borates are less corrosive but users should still consult manufacturer recommendations regarding corrosion-resistant fasteners or corrosion protection of fasteners and suitable applications for borate treatments.
More Information
A search on the internet will provide a long list of “hits” on this topic. Information on the following web sites may be especially useful to users of treated wood products:
General:
The Federal Emergency Management Agency (FEMA) provides recommendations for fasteners and connectors used in coastal areas – Technical Bulletin 8-96 Corrosion Protection for Metal Connectors in Coastal Areas.
The American Galvanizers Association (AGA) provides information types of zinc coatings and characteristics of zinc coatings – Zinc Coating
Additional Resources and Information is Available From:
Cross Laminated Timber (CLT) is a prefabricated engineered wood product consisting of at least three layers of solid-sawn lumber or structural composite lumber where the adjacent layers are cross-oriented and bonded with structural adhesive to form a solid wood element. Panels are prefabricated based on the project design and arrive at the job site with windows and doors pre-cut. Size varies by manufacturer, but they can include 3, 5, 7 or more layers.
The 2015 National Design Specification® (NDS®) for Wood Construction has new provisions for CLT. A new CLT chapter, consistent with other wood product chapters has been added. The applicable product standard for CLT is ANSI/APA PRG 320 Standard for Performance-Rated Cross-Laminated Timber and applicable design values are to be obtained from manufacturer’s literature or code evaluation report. Other changes reflected in the 2015 NDS specific to CLT include general connection provisions revised to accommodate CLT in Chapter 12 on Dowel-Type Fasteners; new sections applicable for wood screw and nail withdrawal from end grain of CLT; new sections to address determination of dowel bearing strengths for fasteners installed in CLT; and new placement provisions for fasteners and lag screws.
Common connections for CLT assemblies include wall-to-foundation, wall-to-wall (straight or junction), floor-to-floor, wall-to-floor, and wall-to-roof. Panels may be connected to each other with half-lapped joints or splines made from engineered wood products, while metal brackets, hold-downs and plates are often used to transfer forces. Mechanical fasteners may be dowel-type (e.g., nails, screws, glulam rivets, dowels, bolts) or bearing-type (e.g., split rings, shear plates).
CLT assemblies excel in terms of fire protection because, like heavy timber, they char at a rate that is slow and predictable, maintaining their strength and giving occupants more time to leave the building. CLT structures also tend not to have as many concealed spaces within floor and wall assemblies, which reduces the risk that a fire will spread. The American Wood Council (AWC) conducted a successful ASTM E119 fire resistance test on a CLT wall at NGC Testing Services in Buffalo, NY. The wall, consisting of a 5-ply CLT (approximately 6-7/8 inches thick), was covered on each side with a single layer of 5/8″ Type X gypsum wallboard. The wall was loaded to the maximum load attainable by the NGC Testing Service equipment. The test specimen lasted 3 hours, 5 minutes, and 57 seconds (03:05:57). [NGC-CLT-Report.pdf]
In terms of seismic performance, wood buildings in general perform well because they’re lighter and have more repetition and ductility than structures built with other materials, which make them effective at resisting lateral and uplift forces. However, the Trees and Timber Research Institute of Italy tested a full-scale seven-story CLT building on the world’s largest shake table in Japan with excellent results. Even when subjected to severe earthquake simulation (magnitude of 7.2 and acceleration of 0.8 to 1.2 g), the structure showed no residual deformation after the test. The maximum inter-story drift was 1.5 inches and the maximum lateral deformation at the top of the building was just 11.3 inches.
As with all wood products, the benefits of CLT include the fact that it comes from a renewable and sustainable resource. It also has a low carbon footprint—because the panels continue to store carbon absorbed during the tree’s growing cycle and because of the greenhouse gas emissions avoided by not using products that require large amounts of fossil fuels to manufacture. The architect of the CLT apartment building in the UK estimated that, between the carbon stored in the panels and emissions avoided by not using concrete, he kept about 300 metric tons of carbon out of the atmosphere. The CLT building was also estimated to weigh four times less than its concrete counterpart, which reduced transportation costs, allowed the design team to reduce the foundation by 70 percent, and eliminated the need for a tower crane during construction. It took four carpenters just nine weeks to erect nine stories—and the entire construction process was reduced from 72 weeks to 49.
For technical papers that address building code considerations for CLT:
- Self-Directed Study: Cross Laminated Timber
- New Wood Materials: Cross Laminated Timber (CLT) (link to the Structure Magazine website)
- Introduction to Cross Laminated Timber (10 pages PDF,1.04 MB) Summer 2012
- Wood Construction and the International Building Code (link to the Construction Specifier Magazine website) June 2013
The 2018 NDS includes provisions for CLT.
CLT Handbook available at ThinkWood.com.
Design for Code Acceptance (DCA) #1 Flame Spread Performance of Wood Products provides building-code-accepted flame spread ratings for various wood products and species which are normally used as interior finishes for walls, ceilings, and floors in buildings.
Wood materials may be used as an interior finish in almost all occupancies. IBC Table 803.9 indicates the finish classification required for every occupancy and location within the building. The required classifications (A, B, or C) are ranges of flame spread resulting from testing per ASTM E84 or UL723.
Flame spread classification is usually obtained from the manufacturer, but code officials and designers can also make use of DCA 1 to quickly determine the flame spread of lumber and various engineered wood products. Most wood species qualify as Class C, but some can qualify as Class B. All the products listed in DCA 1 also meet the maximum smoke-developed index of 450 required by the building code (803.1.1).
The flame spread index of fire-retardant-treated wood is required to be 25 or less (Class A) per Section 2303.2. Traditional wood floor coverings are exempt from interior finish requirements, and exposed portions of Type IV (Heavy Timber) structural members are also exempt from the interior finish requirements of the code (Section 804).
For occupancies such as stores, apartments, offices, and other commercial and industrial uses, building codes commonly require floor/ceiling and wall assemblies to be fire-resistance-rated in accordance with standard fire tests. The 2012 International Building Code permits fire-resistance-rating to be established by several methods. Testing is the primary means (703.2, 2012 IBC), but not the only one. The five alternatives shown in 703.3 permit the code official to allow fire-resistance-rating to be established using a number of methods and principles of fire resistance in the code and elsewhere:
- Fire-resistance-rated designs documented in sources.
- Prescriptive designs of fire-resistance-rated building elements, components, or assemblies as prescribed in IBC Section 721.
- Calculations in accordance with IBC Section 722.
- Engineering analysis based on a comparison of building element, component, or assemblies designs having fire-resistance-ratings as determined by the test procedures set forth in ASTM E 119 or UL 263.
- Alternative protection methods as allowed by IBC Section 104.11.
For tested assemblies, AWC’s DCA 3 – Fire-Resistance-Rated Wood Floor and Wall Assemblies describes how interior and exterior wood-frame walls and wood I-joist floors can be used to meet building code requirements for fire-resistance-rated assemblies.
Additional assemblies not shown in DCA 3 can be found in the 2005 ASD/LRFD Manual for Engineered Wood Construction Chapter M16.
Performance of finger-jointed lumber in fire-resistance-rated wall assemblies is also a common question. In 2009 the American Lumber Standards Committee (ALSC) modified the ALSC Glued Lumber Policy to add elevated-temperature performance requirements for end-jointed lumber adhesives intended for use in fire-resistance-rated assemblies. End-jointed lumber manufactured with adhesives which meet the new elevated-temperature requirements is required to be designated as “Heat Resistant Adhesive” or “HRA” on the grade stamp. 2012 IBC Section 2303.1.1.2 on End-Jointed Lumber states “Approved end-jointed lumber is permitted to be used interchangeably with solid-sawn members of the same species and grade. End-jointed lumber used in an assembly required to have a fire-resistance-rating shall have the designation “Heat Resistant Adhesive” or “HRA” included in its grade mark.”
AWC’s Design for Code Acceptance No. 4 (DCA 4) Component Additive Method (CAM) for Calculating and Demonstrating Assembly Fire Endurance describes a procedure to calculate the fire endurance rating of a wood-frame wall, roof, or floor/ceiling assembly. The procedure is based on combining fire resistance times assigned to each separate component of the assembly without the need for additional fire testing. Section 722.6 of the 2012 International Building Code (IBC) provides the basis for this approach and is limited to determining a maximum fire resistance rating of one hour. A simple example of a one hour interior wall is shown in Figure 1 and the accompanying table. Note that a single layer of 5/8-inch Type X gypsum board is assigned a time of 40 minutes and 2×4 wood studs are assigned 20 minutes for a total of 60 minutes.
One question that is often asked is whether this methodology can be applied to individually exposed wood members. For a large structural member with protective membranes directly applied to all of the exposed surfaces of the structural member, there is no code-referenced methodology in the United States to determine the fire-resistance rating of the member. However, research conducted at the USDA Forest Products Lab (FPL) concluded that the fire resistance of a structural wood member with a protective membrane directly applied to all of the fire exposed surfaces can be obtained by adding a fixed time for the protective membrane to the fire resistance of the unprotected element. The tests indicated that times of 30 minutes for a single layer of 5/8-inch Type X gypsum board and at least 60 minutes for a double layer of 5/8-inch Type X gypsum board will result in estimates for the fire resistance of protected structural wood members consistent with the failure times observed in tensile fire-resistance tests of protected structural wood members.

One-hour fire-resistance-rated floor/ceiling assemblies that are derived by ASTM E119 testing are typically constructed with 2×10 or 2×12 joists. Joists of lesser depths, such as 2×8, are generally not permitted to be substituted unless the assembly is retested. However, with approval of the building official, the empirical methods in IBC 721.6 and AWC’s DCA 4 can be used to estimate fire endurance times for 2×8 floor/ceiling assemblies without testing.
Chapter 16 of the National Design Specification (NDS) for Wood Construction provides a code-recognized approach for determining the fire resistance of solid sawn, glulam, and select structural composite lumber (SCL) materials, including laminated veneer lumber (LVL), parallel strand lumber (PSL), laminated strand lumber (LSL), and cross-laminated timber (CLT). Design for Code Acceptance Document 2, titled “Design of Fire-Resistive Exposed Wood Members” (DCA 2) provides resources for users to calculate fire resistance for exposed wood members, in compliance with Chapter 16 of the NDS including flexural members (beams), compression members (columns), and solid lumber including decking and other structural members. Additional information including background, examples, and tables providing allowable load ratios for different member types and sizes can be found in Technical Report 10 (TR10).
See also:
From the DCA 6 Commentary, “Diagonal bracing can contribute to the stiffness of the deck and, therefore, cause additional lateral loads on the posts. Since center posts receive more vertical load than corner posts, additional lateral load can cause overstress.”
Knee braces should only be installed at corner posts. Interior posts should not have knee braces. Diagonal bracing can contribute to the stiffness of the deck and, therefore, cause additional lateral loads on the posts. Since center posts receive more vertical load than corner posts, additional lateral load can cause overstress. For this reason, DCA6 does not show the use of diagonal bracing on center posts.
This FAQ is based on the presentation of BCD303 – Design for Code Acceptance No. 6 – Prescriptive Residential Deck Construction Guide.
Also, see Page 12 of Part II: Design Values for Structural Members for background on the Wet Service Factor.
The IRC allows for 1500 psf to be used unless local conditions are known otherwise.
For this table, a uniform load on the joist never determines the allowable span of the overhang. Only deflection due to the point load or ¼ the length of the main span (whichever controls) limit the length of the overhang. Under a single point load, deflection at the overhang decreases as the main span decreases. Thus for many cases in the table, allowable overhang spans are shorter because the allowable main spans are longer. Where it appears that the overhang spans are inconsistent with the joist spacing, the increased deflection of the overhang is controlling. Where the overhang deflection does not control, the overhang spans are limited to 1/4 the main span and appear consistent with the joist spacing.
For example, the three joists below are the maximum allowable spans for Southern Pine 2×6 joists, which are all deflection controlled. While the allowable overhang span increases as joist spacing increases (widens), it is because the main span significantly decrease in length, which adds stiffness at the overhang. Overall deck length is increased by closer spacing.
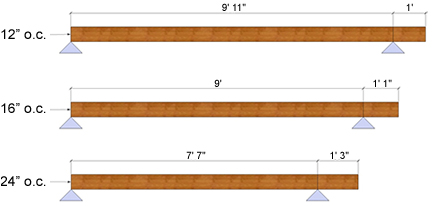
Yes. Any cantilever of the house floor structure over a bearing wall in which the house bandjoist or rimjoist does not have full bearing support would qualify as a cantilever per DCA6. In such cases, a non-ledger deck or engineering evaluation would be required. Where the house rimjoist has full bearing support of a wall or foundation (such as that shown in Figure 14 of DCA6), the vertical load path is continuous, consistent with the design assumptions in DCA6.
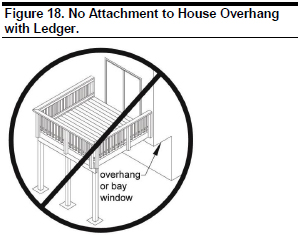
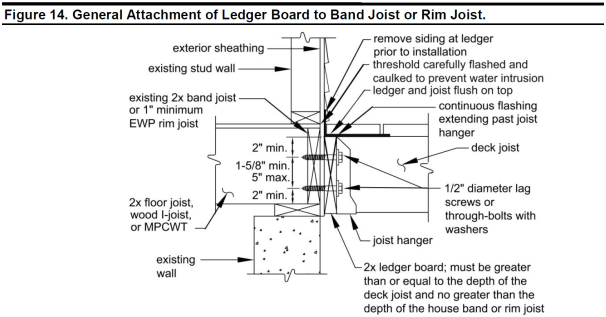
Beginning with the 2015 International Residential Code, wood beams or girders supporting deck floor joists or gravity loads from other sources must have full bearing at supporting posts. At ends of wood beams or girders, a minimum of 1.5” of direct bearing on wood or 3.0” on concrete or masonry is required. Beams and girders are no longer permitted to “straddle” posts and be supported with through-bolts for the transfer of gravity loads to vertical supports, as illustrated below. Additionally, beams and girders must be attached to prevent lateral movement at supports which is commonly achieved either through notching of posts or using manufactured connectors. The illustrations below are from AWC’s Design for Code Acceptance No. 6 (AWC DCA-6). Similar illustrations are found in IRC Figures R507.5.1(1) and (2).
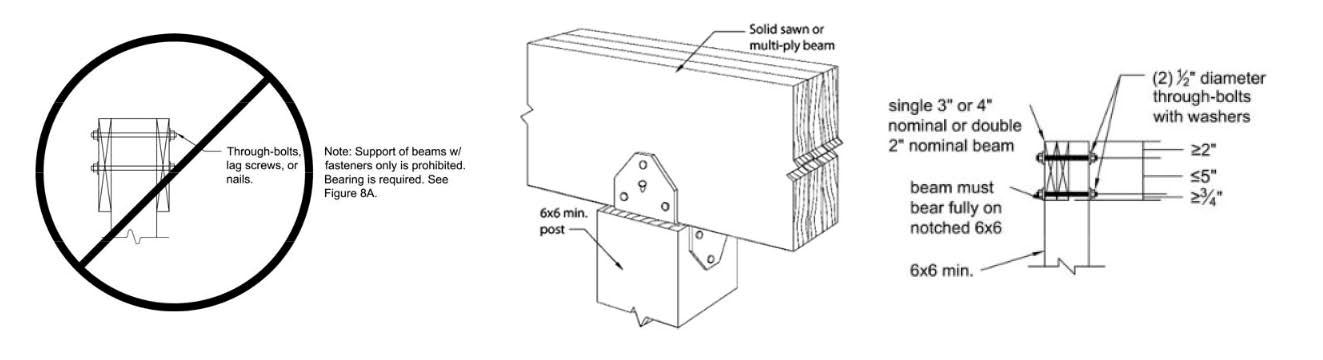
Wood members that are protected from direct moisture in building construction reach an equilibrium moisture content below 19%, which is considered dry service conditions. Design values assigned to lumber and engineered wood products in the AWC National Design Specification® for Wood Construction (ANSI/AWC NDS®) and the NDS Supplement are based on the assumption of dry service conditions. When wood structural members will be regularly exposed to rain or other sources of direct water, an adjustment for wet service conditions, the “Wet Service Factor,” must be applied to the design values because the presence of water affects the moisture content and strength properties of the wood. The Wet Service Factor is not the only adjustment factor that designers consider and use for specific service conditions–others include a Load Duration Factor, Temperature Factor, Flat Use Factor, and Incising Factor, just to name a few.
The new span tables for residential wood decks in the 2018 IRC, and similar tables in AWC’s Design for Code Acceptance No. 6 – Prescriptive Residential Wood Deck Construction Guide (AWC DCA-6), are based on the assumption of wet service conditions. That is, the Wet Service Factor has already been applied in the development of the tables, for conservatism. The designer, in consultation with the code official, has final responsibility for deciding whether the deck should be considered a wet service or dry service application.
View-only downloads of the AWC NDS and Supplement are available. In addition, AWC also has a free span calculator for determining allowable joist spans with an option to include the wet service factor.
Design for Code Acceptance (DCA) #1 Flame Spread Performance of Wood Products provides building-code-accepted flame spread ratings for various wood products and species which are normally used as interior finishes for walls, ceilings, and floors in buildings.
Wood materials may be used as an interior finish in almost all occupancies. IBC Table 803.9 indicates the finish classification required for every occupancy and location within the building. The required classifications (A, B, or C) are ranges of flame spread resulting from testing per ASTM E84 or UL723.
Flame spread classification is usually obtained from the manufacturer, but code officials and designers can also make use of DCA 1 to quickly determine the flame spread of lumber and various engineered wood products. Most wood species qualify as Class C, but some can qualify as Class B. All the products listed in DCA 1 also meet the maximum smoke-developed index of 450 required by the building code (803.1.1).
The flame spread index of fire-retardant-treated wood is required to be 25 or less (Class A) per Section 2303.2. Traditional wood floor coverings are exempt from interior finish requirements, and exposed portions of Type IV (Heavy Timber) structural members are also exempt from the interior finish requirements of the code (Section 804).
For occupancies such as stores, apartments, offices, and other commercial and industrial uses, building codes commonly require floor/ceiling and wall assemblies to be fire-resistance-rated in accordance with standard fire tests. The 2012 International Building Code permits fire-resistance-rating to be established by several methods. Testing is the primary means (703.2, 2012 IBC), but not the only one. The five alternatives shown in 703.3 permit the code official to allow fire-resistance-rating to be established using a number of methods and principles of fire resistance in the code and elsewhere:
- Fire-resistance-rated designs documented in sources.
- Prescriptive designs of fire-resistance-rated building elements, components, or assemblies as prescribed in IBC Section 721.
- Calculations in accordance with IBC Section 722.
- Engineering analysis based on a comparison of building element, component, or assemblies designs having fire-resistance-ratings as determined by the test procedures set forth in ASTM E 119 or UL 263.
- Alternative protection methods as allowed by IBC Section 104.11.
For tested assemblies, AWC’s DCA 3 – Fire-Resistance-Rated Wood Floor and Wall Assemblies describes how interior and exterior wood-frame walls and wood I-joist floors can be used to meet building code requirements for fire-resistance-rated assemblies.
Additional assemblies not shown in DCA 3 can be found in the 2005 ASD/LRFD Manual for Engineered Wood Construction Chapter M16.
Performance of finger-jointed lumber in fire-resistance-rated wall assemblies is also a common question. In 2009 the American Lumber Standards Committee (ALSC) modified the ALSC Glued Lumber Policy to add elevated-temperature performance requirements for end-jointed lumber adhesives intended for use in fire-resistance-rated assemblies. End-jointed lumber manufactured with adhesives which meet the new elevated-temperature requirements is required to be designated as “Heat Resistant Adhesive” or “HRA” on the grade stamp. 2012 IBC Section 2303.1.1.2 on End-Jointed Lumber states, “Approved end-jointed lumber is permitted to be used interchangeably with solid-sawn members of the same species and grade. End-jointed lumber used in an assembly required to have a fire-resistance-rating shall have the designation “Heat Resistant Adhesive” or “HRA” included in its grade mark.”
AWC’s Design for Code Acceptance No. 4 (DCA 4) Component Additive Method (CAM) for Calculating and Demonstrating Assembly Fire Endurance describes a procedure to calculate the fire endurance rating of a wood-frame wall, roof, or floor/ceiling assembly. The procedure is based on combining fire resistance times assigned to each separate component of the assembly without the need for additional fire testing. Section 722.6 of the 2012 International Building Code (IBC) provides the basis for this approach and is limited to determining a maximum fire resistance rating of one hour. A simple example of a one hour interior wall is shown in Figure 1 and the accompanying table. Note that a single layer of 5/8-inch Type X gypsum board is assigned a time of 40 minutes and 2×4 wood studs are assigned 20 minutes for a total of 60 minutes.
One question that is often asked is whether this methodology can be applied to individually exposed wood members. For a large structural member with protective membranes directly applied to all of the exposed surfaces of the structural member, there is no code-referenced methodology in the United States to determine the fire-resistance rating of the member. However, research conducted at the USDA Forest Products Lab (FPL) concluded that the fire resistance of a structural wood member with a protective membrane directly applied to all of the fire exposed surfaces can be obtained by adding a fixed time for the protective membrane to the fire resistance of the unprotected element. The tests indicated that times of 30 minutes for a single layer of 5/8-inch Type X gypsum board and at least 60 minutes for a double layer of 5/8-inch Type X gypsum board will result in estimates for the fire resistance of protected structural wood members consistent with the failure times observed in tensile fire-resistance tests of protected structural wood members.
One-hour fire-resistance-rated floor/ceiling assemblies that are derived by ASTM E119 testing are typically constructed with 2×10 or 2×12 joists. Joists of lesser depths, such as 2×8, are generally not permitted to be substituted unless the assembly is retested. However, with approval of the building official, the empirical methods in IBC 721.6 and AWC’s DCA 4 can be used to estimate fire endurance times for 2×8 floor/ceiling assemblies without testing.
Chapter 16 of the National Design Specification (NDS) for Wood Construction provides a code-recognized approach for determining the fire resistance of solid sawn, glulam, and select structural composite lumber (SCL) materials, including laminated veneer lumber (LVL), parallel strand lumber (PSL), laminated strand lumber (LSL), and cross-laminated timber (CLT). Design for Code Acceptance Document 2, titled “Design of Fire-Resistive Exposed Wood Members” (DCA 2) provides resources for users to calculate fire resistance for exposed wood members, in compliance with Chapter 16 of the NDS including flexural members (beams), compression members (columns), and solid lumber including decking and other structural members. Additional information including background, examples, and tables providing allowable load ratios for different member types and sizes can be found in Technical Report 10 (TR10).
See also:
Details for exterior wall/floor intersections in Type III construction are included in Design for Code Acceptance No. 3 Fire Resistance Rated Wood Frame Wall and Floor Assemblies (AWC DCA-3). The details may be helpful when a one-hour floor ceiling assembly intersects with a two-hour exterior wall in traditional platform construction, if there are concerns about the continuity of the exterior wall rating. The details are accompanied by text which explains the methodology for maintaining the fire resistance of both assemblies.
Wood and wood-based products are widely used in building construction, due in part to favorable energy performance characteristics. As energy codes become more demanding, use of wood products in the building envelope provides greater advantages due to wood’s natural thermal resistance and low embodied energy combined with excellent structural performance and constructability. Ensuring the building envelope achieves ever-increasing levels of performance can be difficult, especially for walls where framing, fenestration, and insulation details affect overall energy performance. DCA 7 – Meeting Residential Energy Requirements with Wood-Frame Construction – 2012 IECC Version provides ways to economically meet the residential requirement of the 2012 International Energy Conservation Code (IECC).
Chapter 7 of the 2015 NDS says:
7.1.2 The term “prefabricated wood I-joist” refers to a structural member manufactured using sawn or structural composite lumber flanges and wood structural panel webs bonded together with exterior exposure adhesives, forming an “I” cross-sectional shape.
Design procedures and other information provided in the NDS apply only to prefabricated wood I-joists conforming to all pertinent provisions of ASTM D 5055.
The IBC gives code requirements for wood I-joists in Section 2303.1.2, and the IRC gives code requirements in Section R502.1.2.
For further information relating to code and standards requirements, see here: Download PDF
Chapter 8 of the 2015 NDS says:
8.1.2.5 The term “structural composite lumber” refers to either laminated veneer lumber, parallel strand lumber, laminated strand lumber, or oriented strand lumber. These materials are structural members bonded with an exterior adhesive.
Design procedures and other information provided in the NDS apply only to structural composite lumber conforming to all pertinent provisions of ASTM D 5456.
The IBC gives code requirements for wood I-joists in Section 2303.1.10, and the IRC gives code requirements in Section R502.1.5.
For further information relating to code and standards requirements, see here: Download PDF
The provisions of NDS Chapter 16 and FDS Chapter 3 are intended to allow the designer to use analytical methods to establish the fire resistance time associated with a wood member or assembly tested to an ASTM E119 fire exposure. In this mechanics-based design method, wood design properties intended for structural design are adjusted to nominal strengths for fire resistance calculations. These nominal strengths are used with cross-sections, reduced due to charring of the wood, to calculate the time to structural failure of a wood member or assembly. As such, application of the slenderness limits intended to provide safe structural designs to provisions for estimating structural failure time is unnecessary and would reduce accuracy of the estimated failure time. Reference to the equation 3.7-1 is provided within Chapter 16 to remind the user that the stability equations should be applied in the design of columns. Reference to the stability equations like 3.7-1 were only to remind the user that stability equations should be applied, but not intended to require application of design slenderness ratio limitations that are specific to structural design. As stated in NDS Commentary Section C16.1, these provisions do not address procedures for evaluating members for continued service following fire damage.
Warnock Hersey published a report on a 1-hour fire test. For more information, contact Warnock Hersey at (608) 836-4400.
For any additional help, contact AWC.
Fire retardant treatments (FRT) on wood products retard the ability of flames to spread across the surface of wood products. However, fire retardants do not reduce the rate at which wood degrades when subjected to an external heat source. Accordingly, fire retardant treatments do not improve fire resistance ratings to any significant extent. The user is reminded that NDS 2.3.4 requires the effects of fire retardant chemical treatment on strength to be addressed in design.
Does fire retardant treatment (FRT) make wood non-combustible?
FRT wood does not meet the requirements for noncombustible materials. However, in recognition of its very low flamespread characteristic, the International Building Code (IBC) allows FRT wood to be used in many applications otherwise required to be of non-combustible construction. See the construction type definitions in Chapter 6 of the code, and also Section 603 which lists many applications for FRT wood in noncombustible construction types.
See also the Fire FAQ: “Where can I find publications on fire retardant treated wood?”
The 2012 IBC Section 2303.1.1.2 states: Approved end-jointed lumber is permitted to be used interchangeably with solid-sawn members of the same species and grade. End-jointed lumber used in an assembly required to have a fire-resistance-rating shall have the designation “Heat Resistant Adhesive” or “HRA” included in its grade mark. In 2009 the American Lumber Standards Committee (ALSC) modified the ALSC Glued Lumber Policy to add elevated-temperature performance requirements for end-jointed lumber adhesives intended for use in fire-resistance-rated assemblies. End-jointed lumber manufactured with adhesives which meet the new requirements is being designated as “Heat Resistant Adhesive” or “HRA” on the grade stamp.
The ALSC Glued Lumber Policy requires that Heat Resistant Adhesives be qualified in accordance with one of two new ASTM standards, D7374-08 Practice for Evaluating Elevated Temperature Performance of Adhesives Used in End-Jointed Lumber and D7470-08 Practice for Evaluating Elevated Temperature Performance of End-Jointed Lumber Studs. Both standards require a wall assembly made with end-jointed lumber to be subjected to the ASTM E119 fire test. The tested-adhesive qualifies as a Heat Resistant Adhesive if the wall assembly achieves a one-hour fire-resistance-rating. End-jointed lumber manufactured with a Heat Resistant Adhesive under an auditing program of an ALSC-accredited grading agency is allowed to carry the HRA mark on the grade-stamp. End-jointed lumber manufactured with an adhesive not qualified as a Heat Resistant Adhesive will be designated as “Non-Heat Resistant Adhesive” or “non-HRA” on the grade stamp. Lumber carrying the HRA mark is permitted to be used interchangeably with solid-sawn members of the same species and grade in fire-resistance-rated applications.
For more information, please contact AWC at 202-463-4713 or [email protected].
A legacy publication titled Design of Firestopping and Draftstopping for Concealed Spaces provides recommendations on where and how fire/draftstopping should be used to prevent spread of fire by restricting movement of flame, air, gasses, and smoke in buildings. 16 pages. (T45) Available from the AWC Helpdesk upon request: [email protected].
Columns and beams in Type IV-HT construction are not required to be fire-resistance rated by IBC Table 601, which only requires them to be of “HT” (heavy timber) dimensions, which are found in Table 2304.11. Connections of heavy timber members that are not fire resistance rated are not required to be protected. However, for heavy timber members in any type of construction that are required to be fire-resistance rated by other provisions of the code (for instance, a column or beam that supports a required fire-resistance rated floor), Section 704 of the IBC requires their connections to other structural members to be protected for least the fire-resistance rating of the connected members. Chapter 16 of the NDS, which is referenced in Section 722 of the IBC, requires this protection to be provided by wood cover, fire-rated gypsum board, or other approved material.
Details for exterior wall/floor intersections in Type III construction are included in Design for Code Acceptance No. 3 Fire Resistance Rated Wood Frame Wall and Floor Assemblies (AWC DCA-3). The details may be helpful when a one-hour floor ceiling assembly intersects with a two-hour exterior wall in traditional platform construction, if there are concerns about the continuity of the exterior wall rating. The details are accompanied by text which explains the methodology for maintaining the fire resistance of both assemblies.
ICC Evaluation Services Acceptance Criteria 479 Wood Structural Panels with a Factory-Applied Fire-Retardant Coating was expanded in scope in 2018 to include sawn lumber. AWC anticipates that multiple manufacturers of liquid-applied fire retardants intended for use with wood products will seek alternate materials and methods approvals for sawn lumber applications of their products. Additionally, multi-family builders may choose to use new fire retardant products on sawn lumber as a construction fire prevention measure.
Among the changes approved in the current code change cycle was G109-18, which will, for the first time, allow concealed spaces in traditional Type IV heavy timber buildings. The concealed spaces must be protected with one or more of the following three alternatives:
- the building is sprinklered throughout and sprinkler protection is provided in the concealed space,
- surfaces in the concealed space are fully sheathed with 5/8-inch Type X gypsum board, or
- the concealed space is filled completely with noncombustible insulation.
There is an exception for stud spaces in framed one-hour interior walls and partitions, which are permitted in Type IV-HT construction.
These same provisions have often been accepted by code officials through alternate methods as necessary protection for concealed spaces in traditional Type IV construction. The 2021 edition of the IBC will have a code path for acceptance without resorting to the alternative methods and materials section of the code. This should greatly help in the rehabilitation of many existing heavy timber buildings that are being put back into use as new occupancies and will allow new construction of Type IV-HT with concealed spaces that are commonly found in residential occupancy groups where ceilings may conceal overhead plumbing and mechanicals.
The 2021 International Building Code will require a Site Safety Director, employed by the building owner, to conduct and document daily construction fire safety inspections. This is only one of several new requirements approved in F263-18 and F264-18 for buildings under construction. According to the new requirements, the fire official is authorized to issue a stop work order upon repeated omissions in inspection and/or documentation of the following:
- the training qualifications of hot work contractors admitted to the site (must have received training in the hot work safety requirements of IFC Chapter 35)
- observing that hot work is performed only in pre-approved locations
- safety of temporary heating equipment
- removal of trash and debris
- safety of temporary wiring
- safe storage of flammable liquids and hazardous materials
- openness of fire access roads
- fire hydrant visibility and access
- availability of operating standpipes as construction progresses
- fire extinguisher placement
The National Fire Protection Association reports that for a five-year period from 2010 through 2014, fires at sites undergoing construction, major renovation, and demolition averaged 17% of annual fire department structure fire responses and 3.2% of annual fire losses in the U.S. For more information see https://constructionfiresafety.org/.
Attic fires can be a significant hazard in residential mid-rise structures. The 2018 IBC has provisions for increased attic protection based on the height of the building. For wood construction, when the roof assembly exceeds 55 feet above the lowest level of required fire department vehicle access, the attic must be protected by sprinklers or alternative protection must be provided. This means that certain special occupancy “pedestal” buildings must have sprinkler-protected attics even if they could have an NFPA 13R sprinkler system (as opposed to a full NFPA 13 system). See subsection 903.3.1.2.3 Attics in the 2018 IBC for the full requirements.
A reminder: sprinklers do no good if a fire begins before sprinklers are operational. See the Construction Fire Safety Coalition website for resources on preventing construction fires: www.constructionfiresafety.org
Section 704.2 of the 2018 International Building Code (IBC) was revised from its origin which began in the legacy building codes and was primarily intended to address steel construction. In earlier editions of the IBC, omission of fireproofing on portions of steel columns or beams behind ceiling or wall membranes of fire-resistance-rated assemblies was permitted. During more recent code development cycles, it was agreed that membrane protection alone was inadequate, especially for members carrying the upper floors of a building, since they could be exposed to fire which originates in a concealed space or from fire in a room if the membrane protection fails. Because steel has no inherent fire resistance (steel can yield quickly at temperatures commonly occurring in fires), the method and location of the protection is considered critical.
The 2018 IBC was revised to clearly indicate that columns as well as studs and boundary elements in walls of light-frame construction and are located entirely between the top and bottom plates are permitted to have their required fire resistance ratings provided by the membrane protection for the wall. Elements within fire-resistance-rated walls of light-frame construction are addressed directly in IBC Section 704.4.1 (Light-frame Construction) and can be part of a fire-resistance-rated wall assembly without any additional fire protection. Many buildings are built out of typical light frame construction; the concentrated loads from trusses or beams must have a continuous load path to the foundation. Previously, some jurisdictions were interpreting that these construction elements were considered primary structural columns and requiring them to be provided with individual fire protection. It was never the intent to require individual fire protection of these elements as they are not considered a portion of the primary structural frame.
IBC Section 202 defines the Primary Structural Frame as the Columns; Structural Members, Floor Construction and Roof Construction (all having direct connections to the columns); and Bracing members essential to the vertical stability of the primary structural frame under gravity loading. IBC Section 704.2 requires all columns, that are required to be protected, to be protected with individual encasement protection throughout the entire column length. This section clarifies that columns extending up through the ceiling must extend the required encasement protection from the foundation to the beam above.
By definition, a light-frame construction wall is primarily built with repetitive studs. When braced by sheathing or gypsum board attached to the wall framing, the design of studs, multiple studs, or posts is similar based on the L/d for the member buckling out of the plane of the wall. Perpendicular to grain bearing of the studs on the top and bottom plates is also a consideration and is the same regardless of whether the studs are spaced, studpacks, or posts. The structural design of all of these members is considered column design. In previous editions of the IBC or legacy codes an issue sometimes occurred when studs, multiple studs, or solid sawn members were framed integrally within a fire-resistance-rated light frame wall and were treated as columns according to the definition of primary structural frame, and were then required to be provided with individual encasement protection.
The intent of Sections 704.2 and 704.4.1 have been clarified in the 2018 IBC to state studs, boundary elements, posts, multiple stud groups, built-up columns, and solid columns that are framed within the wall and do not penetrate the top or bottom plates are all designed to the same criteria and shall be considered integral elements. These elements that are integral within the confines of the load bearing wall, and do not penetrate the top or bottom plates, are permitted to be protected in light frame construction by the membrane protection of the fire-resistance-rated bearing wall.
What is the correct application of 2018 IBC Section 704.3 (Protection of the primary structural frame other than columns) to wood construction?
Definitions for “primary structural frame” and “light-frame construction” are included in IBC Chapter 2. IBC Section 704.3 (Protection of the primary structural frame other than columns) is for systems that meet the definition of “primary structural frame,” but not heavy timber or light-frame construction. Floor joists, ceiling joists, and rafters in light-frame construction do not fall within the definition of primary structural frame. Likewise, wood beams, if required to be rated, (Type IIIA or VA building) are typically part of a light-frame system. Their fire resistance would be established by normal means, whether calculating fire resistance as an exposed wood member or protecting with other materials. As for Type IV, Table 601 requires no fire resistance rating for structural elements, as long as they meet the minimum required dimensions for Type IV construction as specified in IBC Section 2304.11.sf.
There are no specific code requirements or allowances in the IBC for determining the fire resistance of a connection itself. In fact, there are no code-prescribed means of establishing the fire resistance of a connection by itself. The standard fire-resistance tests referenced in the IBC (ASTM E119 and UL 263) do not provide the necessary protocol for testing a connection configuration in the furnace. However, the IBC does require fire protection of connections, and this protection must consist of materials that provide a fire-resistance rating not less than that required of the connected members. Specifically, IBC Sections 704.2 and 704.3 make explicit reference to the requirement for fire protection of connections as follows:
704.2 Column protection. Where columns are required to have protection to achieve a fire-resistance rating, the entire column shall be provided individual encasement protection by protecting it on all sides for the full column height, including connections to other structural members, with materials having the required fire-resistance rating. Where the column extends through a ceiling, the encasement protection shall be continuous from the top of the foundation or floor/ceiling assembly below through the ceiling space to the top of the column.
704.3 Protection of the primary structural frame other than columns. Members of the primary structural frame other than columns that are required to have protection to achieve a fire-resistance rating and support more than two floors or one floor and roof, or support a load-bearing wall or a nonload-bearing wall more than two stories high, shall be provided individual encasement protection by protecting them on all sides for the full length, including connections to other structural members, with materials having the required fire-resistance rating.
It should be noted that these code sections are not specific to any particular construction type or construction material; so they apply to connections in steel construction, concrete construction, and the new mass timber construction types alike. That said, most of the members in traditional heavy timber construction (now called Type IV-HT) are not required to meet an explicit fire resistance rating, so the connections between these members are not necessarily required to be protected.
For connections between structural members in the new mass timber construction types (Types IV-A, IV-B and IV-C), the protection time provided by the fire protection to be applied over the connection must be determined based on a standard fire exposure. Section 703.3 provides the various methods that are permitted for establishing the fire-resistance rating of building elements, component or assemblies based on a standard fire exposure. These are as follows:
- Fire-resistance designs documented in approved sources.
- Prescriptive designs of fire-resistance-rated building elements, components or assemblies as prescribed in Section 721.
- Calculations in accordance with Section 722.
- Engineering analysis based on a comparison of building element, component or assemblies designs having fire-resistance ratings as determined by the test procedures set forth in ASTM E119 or UL 263.
- Alternative protection methods as allowed by Section 104.11.
- Fire-resistance designs certified by an approved agency.
- The procedure for protecting connections provided in AWC Technical Report No. 10 (TR10) is based on the results of ASTM E119 tests, particularly as it pertains to the char rate of wood and/or the performance of gypsum wallboard. Thus, these TR10 provisions for protecting connections with wood and/or gypsum wallboard provide a means of determining fire resistance that is in compliance with item 4 of IBC Section 703.3.
The video was published in 1993 by Odyssey Productions, Inc. and was sponsored by WWPA, AF&PA, SFPA, and APA. Contact SFPA (Southern Forest Products Association) at 504-443-4464 or http://www.sfpa.org. Ref #AV45
- International Codes Council
ICC Consensus Committee on Log Structures (IS-LOG): Information on the development of the ICC Standard on Design, Construction and Performance of Log Structures (ICC-400).- ICC Headquarters
- 5203 Leesburg Pike
Suite 600, Falls Church, VA 22041
- 5203 Leesburg Pike
- Phone: (888) ICC-SAFE (422-7233)
- Fax: (703) 379-1546
- Website: http://www.iccsafe.org/
- ICC Headquarters
- Log Homes Council (National Association of Home Builders)
- 1201 15th Street
Washington, D.C 20005 - Phone: (800) 368-5242, ext. 8576
- Fax: (202) 266-8141
- Email: [email protected]
- Website: http://www.loghomes.org
- All Log Home Council members must participate in a monitored Log Grading Program. Their technical consultant is:
- 1201 15th Street
- Mr. Rob Pickett
- Rob Pickett & Associates
- PO Box 490
Hartland, VT 05048-0490 - Phone: (802) 436-1325
- Fax: (803) 436-1325
- Email: [email protected]
- Website: http://robpickettandassoc.com/
- Visual Stress Grading of Wall Logs and Sawn Round Timbers Used in Log Structures, by Edwin J. Burke, Ph.D., Univ. of Montana, Wood Design Focus, Vol. 14, No. 1. Abstract: This article explains the need for and the history and process of stress grading logs used in construction of log structures and offers practical information for engineers, architects, and code officials working with this type of construction system. For ordering information, visit http://www.forestprod.org/
- Dr. Edwin J. Burke
- Professor of Wood Science
University of Montana
School of Forestry; Wood Science Associates - 2617 Garland Drive
Missoula, MT 59803 - Phone: (406) 251-4325
- Fax: (406) 251-6189
- Email: [email protected]
- Professor of Wood Science
- ASTM D3957 – 09(2015) Standard Practices for Establishing Stress Grades for Structural Members Used in Log Buildings defines two types of structural members used in log buildings; Wall-Logs and Sawn Round Timber Beams. For more information, visit http://www.astm.org/
AWC Wood Frame Construction Manual (WFCM) 2015 Edition is presently referenced in model building codes such as the IBC (International Building Code) and IRC (International Residential Code). The WFCM is an ANSI-approved document that provides engineered and prescriptive requirements for wood frame construction based on dead, live, snow, seismic, and wind loads from ASCE 7-10 Minimum Design Loads for Buildings and Other Structures.
AWC Special Design Provisions for Wind and Seismic (SDPWS) 2015 Edition is presently referenced in model building codes such as the IBC. The SDPWS is an ANSI-approved document that covers materials, design, and construction of wood members, fasteners, and assemblies to resist wind and seismic forces.
Wood has a high strength-to-weight ratio. Since wood is lighter than steel or concrete, there is less mass to move—a critical factor during an earthquake. Wood members connected with steel fasteners create a very ductile (flexible) assembly which is less prone to brittle failures often seen with unreinforced masonry or concrete structures.
Multiple, repetitive wood members (studs, joists, and rafters at 16”-24” on-center) provide redundancy in wood assemblies making them less prone to catastrophic collapse. Wood’s renewability, low life-cycle environmental impacts, and ability to sequester carbon provides the optimal combination of green building and stability for earthquake-prone areas.
Tests have proven the viability of wood frame structures under seismic loads.
Here are some resources for this issue:
- General information is available in the ASD/LRFD Manual. The longitudinal direction shrinkage (from green to oven dry) for normal wood usually ranges from 0.1 to 0.2 percent of the green dimension. For the radial and tangential directions, there is an approximate 1% change in dimensions per 4% change in moisture content.
- USDA Wood Handbook Chapter 4.
- WWPA Shrinkage Tech
- Canadian Wood Council’s “DimensionCalc” will calculate for the dimensional change in wood due to shrinkage
For information on timber bridge design and construction, contact one of the following organizations:
- Forest Products Laboratory’s Timber Bridge Design Manual. (608) 231-9200. For more information, visit http://www.fpl.fs.fed.us
- American Institute of Timber Construction’s revised Timber Bridge brochure. Visit their website at http://www.aitc-glulam.org
- National Wood in Transportation Information Center
USDA Forest Service
180 Canfield Street
Morgantown, WV 26505
Phone: (304) 285-1591
Fax: (304) 285-1596
Email: [email protected]
Website: http://www.na.fs.fed.us/werc/
A typical timber frame structure utilizes posts and beams, shaped at their connections to lock together. Modern timber frame work is generally exposed.
Find information from Volume 14, Number 3 of Wood Design Focus.
Also see the Timber Framers Guild.
Contact APA – the Engineered Wood Association for additional assistance. AITC’s Timber Construction Manual contains information on bowstring trusses.
Method Increased Buckling Capacity of Built-Up Beams and Columns by Donald A. Bender, Robert E. Kimble, and Frank E. Woeste appeared in the 2010 Winter (Vol.20, No. 4) issue of Wood Design Focus.
Stability of Built-Up Timber Beams and Columns: Accounting for Modulus of Elasticity Variability by Robert E. Kimble, P.E. and Donald A. Bender, P.E. appeared in ASCE’s Practice Periodical on Structural Design and Construction, Vol. 15, No. 4, November 1, 2010.
Calculating buckling capacity of built-up beams and columns by Donald A. Bender, PE; Robert E. Kimble, PE; Frank E. Woeste, PE.
The National Association of Home Builders (NAHB) publishes a publication titled Residential Construction Performance Guidelines, which has information on construction tolerances. There are versions for both homeowners and contractors. Visit http://www.builderbooks.com/ for ordering information.
National Association of Home Builders
1201 15th Street, NW
Washington, DC 20005
Phone: (202) 266-8200
Toll-Free: (800) 368-5242
Fax: (202) 266-8400
In addition, WoodWorks offers information on Common Construction Tolerance Limits for Light-frame Wood Construction.
Fastener Corrosion
Background
Starting January 1, 2004, Chromated Copper Arsenate (CCA) treated wood products were no longer permitted to be manufactured for general sale, with only some minor exceptions for use in limited, well-defined applications. (See https://www.epa.gov/ingredients-used-pesticide-products/chromated-arsenicals-cca
for more information.). Some of the commonly available preservative-treated wood products will be treated with ammoniacal copper quat (ACQ), copper azole (CBA/CA-B), or ammoniacal copper zinc arsenate (ACZA). While these alternative treating chemicals have been proven to be effective wood preservatives when used in accordance with AWPA standards, there is some evidence that these chemicals are more corrosive than CCA to metal fasteners and connectors.
The purpose of this document is to provide answers to some specific questions related to this issue. Users are cautioned that this information is only a synthesis of reports currently available from public sources. A number of sources are attempting to assess the corrosivity of treatment chemicals. Updates will be issued as new or additional information becomes available.
Questions and Answers
Q: Lumber treated with CCA has been available for many years. Does metal corrode in contact with CCA-treated lumber?
The chemicals used in CCA-treated lumber have been shown to be somewhat corrosive to fasteners and connectors. Accordingly, chemical manufacturers and the treated lumber industry have traditionally recommended and the model building codes have required the use of corrosion-resistant fasteners and connectors when used with CCA-treated lumber.
Q: What’s different with the new alternative treatments?
When subjected to standardized laboratory tests that accelerate the corrosion process, metal connectors and fasteners exposed to the chemicals used in ACQ, Copper Azole, or ACZA exhibit higher rates of corrosion than connectors and fasteners exposed to CCA. Discussions within the affected industries are attempting to sort out the significance of these differences in real-world applications.
Q: What should users do while the technical issues are being evaluated?
At the very least, users should rigorously apply the recommendations of the chemical manufacturers and the treating industry—to use corrosion-resistant fasteners and connectors or zinccoated (galvanized) fasteners and connectors with corrosion protection at least equivalent to that of hot-dip galvanized products.
Q: What zinc coating specifications apply to hot-dip galvanized products used in wood building construction?
Specifications for sheet metal connectors (joist hangers and metal straps) and fasteners (such as nails and bolts) are addressed in separate ASTM standards. Coating weight designations for sheet steel are specified in ASTM A 653, Standard Specification for Steel Sheet, Zinc-Coated (Galvanized) or Zinc-Iron Alloy-Coated (Galvannealed) by the Hot-Dip Process. An example zinc coating designation in ASTM A 653 is G185 where “G” indicates zinc coating and “185” indicates a total of 1.85 oz/ft2 of coating on both sides of the steel sheet. For fasteners, minimum coating weights are specified in ASTM A 153, Standard Specification for Zinc Coating (Hot-Dip) on Iron and Steel Hardware. A Class D designation applies for fasteners 3/8” in diameter and smaller. The minimum coating weight associated with Class D is 1.0 oz/ft2.
Q: Is there a difference between “hot-dip” galvanized products and other types of galvanized products manufactured using a different process?
There are a variety of processes for galvanizing metal products other than the hot-dip process. These include electrolysis (electrogalvanized, zinc plated) and peening (mechanical plating). There are some differences and issues that users should be aware of:
Coating thicknesses developed by the electrolysis process may be too thin. Most commonly available electrogalvanized or zinc-plated fasteners and connectors do not have a sufficient coating of zinc for these new chemicals.
The density of the coating can be less than provided by the hot-dip process. For example, mechanically deposited coating in accordance with ASTM B 695 Standard Specification for Coatings of Zinc Mechanically Deposited on Iron and Steel has a density that is approximately 75% of the density of the zinc coating resulting from the hot-dip process. Approximately 33% greater coating thickness is needed to produce the same level of zinc per unit area as provided by the hot-dip process.
Q: What connectors provide maximum corrosion resistance?
Type 304 and 316 stainless steel have been used to provide maximum corrosion resistance. Type 304 and 316 stainless steel connectors and fasteners have been used in demanding applications such as coastal exposures and in permanent wood foundations.
Q: What other details should users and specifiers be aware of?
There are other issues that have been reported that are important to users:
Never mix galvanized steel with stainless steel in the same connection. When these dissimilar metals are in physical contact with each other, galvanic action will increase the corrosion rate of the galvanized part (the zinc will migrate off the galvanized part onto the stainless part at a faster rate).
Galvanizing provides a sacrificial layer to protect the steel connector or fastener. Greater thicknesses (coating weights—see Table 1) generally provide longer protection in corrosive environments.
Aluminum should not be used in direct contact with CCA, ACQ, Copper Azole, or ACZA.
Q: Are all alternative treatments more corrosive than CCA?
The majority of the research has been conducted on the corrosivity of ACQ and Copper Azole. Comparative testing has indicated that borates are less corrosive but users should still consult manufacturer recommendations regarding corrosion-resistant fasteners or corrosion protection of fasteners and suitable applications for borate treatments.
More Information
A search on the internet will provide a long list of “hits” on this topic. Information on the following web sites may be especially useful to users of treated wood products:
General:
The Federal Emergency Management Agency (FEMA) provides recommendations for fasteners and connectors used in coastal areas – Technical Bulletin 8-96 Corrosion Protection for Metal Connectors in Coastal Areas.
The American Galvanizers Association (AGA) provides information types of zinc coatings and characteristics of zinc coatings – Zinc Coating
Additional Resources and Information is Available From:
Schein, E.W. 1968. The Influence of design on exposed wood in buildings of the Puget Sound area. Portland, OR: U.S. Department of Agriculture, Forest Service, Pacific Northwest Research Station. 41 p.
Part A (PDF 2.77 Mb)
Part B (PDF 2.70 Mb)
Part C (PDF 2.64 Mb)
Part D (PDF 2.43 Mb)
Part E (PDF 2.60 Mb)
- Dolan and Woeste developed some information on controlling vibration published in Structural Engineer magazine.
- APA Technical Note called Minimizing Floor Vibration by Design and Retrofit
http://www.apawood.org/SearchResults.aspx?q=E710&tid=1 - Wood Design Focus paper by Dolan and Kalkert called “Overview of Proposed Wood Floor Vibration Design Criteria” (Vol. 5, #3).
Shear parallel to grain (Fv) values along with compression perpendicular to grain (Fc?), bending (Fb), tension parallel to grain (Ft), compression parallel to grain (Fc), and modulus of elasticity (E) values are located in the NDS supplement, Design Values for Wood Construction.
Here are a couple of contacts for information on fiber reinforcing for products like glulam:
- Dr. Habib Dagher
Advanced Engineered Wood Composites Lab
University of Maine – Orono
Phone: (207) 581-2138
E-mail: [email protected]
Website: http://composites.umaine.edu/
- APA – The Engineered Wood Association
- Bruce Pooley, Colorado P.E.
Phone: (303) 989-8701
E-mail: [email protected]
Chapter 5 of the NDS contains design information for glued-laminated timber.
Here is a list of adhesive manufacturers for ASTM D2559 adhesives. These are phenol resorcinol adhesives that are used by glulam manufacturers. Epoxies are not used in glulam.
Georgia-Pacific Chemicals LLC
133 Peachtree Street NE
Atlanta, GA 30303
Phone: 404-652-4000
Website: http://www.gp-chemicals.com/Home
National Casein® Company Headquarters
601 W. 80th Street
Chicago, IL 60620
Phone: 773-846-7300
Fax: 773-487-5709
Email: [email protected]
Website: http://www.nationalcasein.com
Hand rails and guard rails used in highway/bridge construction, have criteria available from the sources below.
AITC’s Glued Laminated Timber Bridge Systems Manual.
http://www.aitc-glulam.org/
Wood Transportation Structures Research Website: Forest Products Laboratory (304) 285-1591. [email protected]
Also see General FAQ “Where can I find information on timber bridge design and construction?”
- Report on International Green Construction Code
- National Association of Homebuilders developed the National Green Building Standard, ICC-700.
- Green Building Guidelines©: Meeting the Demand for Low-Energy, Resource-Efficient Homes© available at https://www.nibs.org/.
- Green Building Initiative – Green Globes – http://www.thegbi.org/
- Green Wood: Building Green with Wood – StructureMag-Green-Wood-7-05.pdf
- Understanding Green Building Ratings – Understanding-Green-Building-Ratings.pdf
- The Unseen Connection: Building Materials and Climate Change (by Bruce Lippke, Ph.D.) – LippkeArticleCAForestsWinter2006.pdf
- Case Study Examines Pluses and Minuses of OVE Framing
http://www.nbnnews.com/NBN/issues/2009-09-28/Green%2BBuilding/index.html
Building Materials Reuse Association – http://bmra.org
USDA Forest Products Lab – http://www.fpl.fs.fed.us/documnts/fplgtr/fpl_gtr150.pdf
Recycler’s World – http://www.recycle.net/Wood/index.html
Dovetail Partners Project Manager for Recycling & Reuse – Steve Bratkovich – http://www.dovetailinc.org
North American Wood Reuse & Recycling Directory – http://reusewood.org/
Environmental Product Declarations (EPDs) for Wood
Q: What are Environmental Product Declarations (EPDs)?
A: An Environmental Product Declaration (EPD) is a document that provides, in a user-friendly format, the environmental impacts, energy usage, and other information that results from a science-based life cycle assessment (LCA) of a product. EPD development is guided by a set of international standards which call for initial creation of a Product Category Rule (PCR) that defines the processes to be used when evaluating some or all of the product’s life-cycle stages.
Q: Are there different types of EPDs?
A: Yes, there are two types of EPDs: business-to-business (B-2-B) and business-to-consumer (B-2-C). B-2-B EPDs are generally limited to specific stages of the life cycle, such as cradle-to-gate, since manufacturers may not be able to characterize how their product might be used after it is sold. B-2-C EPDs cover the full life–cycle of a product, what is referred to as cradle-to-grave. In accordance with the international standards, B-2-C EPDs must be independently verified by a competent third-party to ensure conformance to the LCA report and governing PCR. B-2-B EDPs may elect to have third-party verification.
Q: How are EPDs developed?
A: As noted above, EPDs are developed in compliance with the international standard, ISO 14025 Environmental Labels and Declarations. Under this standard, a program operator is contacted to develop the EPD. The program operator can be a company or a group of companies, industrial sector or trade association, public authority or agency, or an independent scientific body or other organization. An organization declaring itself to be a program operator must develop, maintain, and publish the rules that it will follow that allow for open participation by interested parties or stakeholders, but it is not a formal consensus process. The program operator first determines whether relevant PCRs already exist for the product (even in another country). If they do, then that PCR should be either adopted for use or adapted for identified alternative conditions. Otherwise, the program operator initiates a process to develop a new PCR. Once the PCR has been developed, an LCA that conforms to the PCR is developed. That LCA is the foundation for developing the related EPD. Third-party verification would then involve a competent and independent review by one not involved in the LCA or development of the EPD.
Q: What purpose do EPDs serve?
A: An EPD provides the basis for an evaluation of the environmental performance of products but does not “judge” whether the product or service meets any environmental quality standard. Users of EPDs are able to make their own judgments based on the information presented. An EPD would not include comparisons between products or make reference to any environmental benchmark or baseline. However, when properly structured and verified against the same PCR, the EPD for one alternative can be compared against the EPD for another. The key is that the functional unit must be the same for realistic comparisons. Perhaps most important, an EPD is a disclosure by an company or industry that makes public the standardized environment impacts of its products.
Q: What type of information does an EPD provide?
A: Typically, an EPD will include information about environmental impacts from some or all of a product’s life-cycle stages, given in standard measurements used to quantify impacts on, for example, global warming, ozone depletion, water pollution, ozone creation, etc. EPDs for building products can help architects, designers, specifiers, and other purchasers better understand a product’s sustainable qualities and environmental impacts.
Q: How can I locate an EPD?
A: A program operator is responsible for maintaining publicly available lists and records of relevant PCRs and EPDs developed under their program. While some have argued for national repositories, which could be a useful step, at this point there is no internationally recognized EPD network.
Q: What is a Transparency Brief?
A: Environmental product declarations (EPDs) provide product environmental information distilled from environmental life-cycle assessments (LCA). However, LCAs are often over 100 pages, and many EPDs, which are summaries of the LCA information, can themselves run over 20 pages. Often, specifiers, designers, and others just want to know what the third-party verified, life-cycle based product data is for their material selections. Now, for those wanting “just the facts,” there is the UL Environment (ULE) EPD Transparency Brief, providing the verified environmental information in an easy to understand two-page format.
The EPD Transparency Brief summarizes the most critical data presented in an EPD. The Transparency Brief provides all information about a product, its composition, life-cycle environmental impacts, material content, water and energy usage, and other product information, all in a standardized format. The intent is to make it easier for users to see key details of products and allow them to focus on just environmental data.
The Transparency Brief can also be a useful tool to better understand LCAs and EPDs. ULE has made the Transparency Brief available for all ULE-certified EPD. You can see the wood products industry EPDs and Transparency Briefs by searching ULE’s “Sustainable Products Database.”
Industry participants in the program are instructed to obtain a letter from ULE verifying their participation in the process. ULE has a process in place to accommodate requests of this nature from the manufacturers. You can view AWC-sponsored EPDs on the UL SPOT Directory here.
The National Design Specification® (NDS®) Supplement tables list design values for 2x and larger decking.
The American Lumber Standards Committee (ALSC) provides a Policy for Evaluation of Recommended Spans for Span Rated Decking Products. Here’s more information on their website:
https://alsc.org/lumber-recommended-spans-for-decking/
You will need to contact the specific grading agencies to obtain their span ratings for various species. A list of those agencies is on the ALSC website as well.
Lateral design values for lumber diaphragms and shear walls are available in Special Design Provisions for Wind and Seismic.
See also General FAQ, “Where can I get span tables and span table information for lumber? Where can I get decking span tables?” for span information on decking.
Also see Tongue and Groove Roof Decking – WCD #2.
Also see Plank-And-Beam Framing for Residential Buildings – WCD #4.
Shear parallel to grain (Fv) values along with compression perpendicular to grain (Fc?), bending (Fb), tension parallel to grain (Ft), compression parallel to grain (Fc), and modulus of elasticity (E) values are located in the NDS supplement, Design Values for Wood Construction.
The most recent information on grade rules and grade stamps can be obtained from The American Lumber Standards Committee (ALSC), Incorporated website for untreated and treated lumber. These links give access to facsimile lists of ALSC-certified grading rules, accredited agencies and sample grade stamps. ALSC can be reached via email at [email protected] or 301-972-1700.
Model building codes recognize finger-jointed lumber for the same structural applications as solid sawn lumber with certain qualifications. One such qualification is the fire-performance of end-jointed lumber.
Where can I find information on Lumber Grade Rules and Grade Stamps?
AWC’s code adopted National Design Specification® (NDS®) for Wood Construction, which specifies finger jointed lumber as having the same design values as solid sawn lumber.
From Chapter 4 of the 2005 NDS:
4.1.2.1 When the reference design values specified in the NDS are used, the lumber, including end-jointed or edge-glues lumber, shall be identified by the grade mark of, or certificate of inspection issued by, a lumber grading or inspection bureau or agency recognized as being competent (see Reference 31). A distinct grade mark of a recognized lumber grading or inspection bureau or agency, indicating that joint integrity is subject to qualification and quality control, shall be applied to glued lumber products.
4.1.6 Reference design values for sawn lumber are applicable to structural end-jointed or edge-glued lumber of the same species and grade. Such use shall include, but not be limited to light framing, studs, joists, planks, and decking. When finger jointed lumber is marked “STUD USE ONLY” or “VERTICAL USE ONLY” such lumber shall be limited to use where any bending or tension stresses are of short duration.
The NDS is referenced in all major model building codes in the U.S.
To obtain a copy of the NDS, which is part of the 2005 Wood Design Package, call the AWC publications department at 1-800-890-7732 or visit the website.
Grade Rules
End-joined lumber can be manufactured in different ways. Finger-joints or butt-joints are typical methods of joinery. The standards under which finger-jointed lumber is manufactured are the grading rules for end-joined pieces. These grade rules are promulgated like any other lumber grade rule and are ultimately reviewed by and approved by the American Lumber Standard Committee (ALSC). Finger joints for use in structural applications bear the grade stamp of an agency certified and approved by the Board of Review of ALSC. For more information, see the FAQ here:
Where can I find information on Lumber Grade Rules and Grade Stamps?
Adhesives
ALSC recently modified its Glued Lumber Policy to add elevated-temperature adhesive performance requirements for end-jointed lumber intended for use in fire resistance-rated assemblies. End-jointed lumber manufactured with an adhesive which meets these new requirements is being designated as “Heat Resistant Adhesive” or “HRA” on the grade stamp. End-jointed lumber manufactured with an adhesive not tested or not qualified as a Heat Resistant Adhesive will be designated as “Non-Heat Resistant Adhesive” or “non-HRA” on the grade stamp, and will continue to meet building code requirements when used in unrated construction.
Adhesives used in finger-jointed lumber are of two basic types, depending on whether they are to be used for members with long duration bending loads like floor joists or short duration bending and tension loads like wall studs. Wood products using both types of adhesives have undergone extensive testing by manufacturers. Glued connections in products using the first adhesive type, containing phenolic resins, are sometimes referred to as “Structural Finger Joint,” and typically can be found in structural panels and glued-laminated timber. These products may be used interchangeably with solid sawn lumber in terms of strength and end use, including vertical or horizontal load applications. The second type of adhesive, typically containing polyvinyl compounds, is used with products that are then marked “VERTICAL USE ONLY” or “STUD USE ONLY.” These wood products may be used interchangeably with solid sawn lumber in terms of strength and are intended for applications where bending and tension stresses are of short duration, such as typically found in stud walls.
The 2012 IBC Section 2303.1.1.2 states: Approved end-jointed lumber is permitted to be used interchangeably with solid-sawn members of the same species and grade. End-jointed lumber used in an assembly required to have a fire-resistance-rating shall have the designation “Heat Resistant Adhesive” or “HRA” included in its grade mark. In 2009 the American Lumber Standards Committee (ALSC) modified the ALSC Glued Lumber Policy to add elevated-temperature performance requirements for end-jointed lumber adhesives intended for use in fire-resistance-rated assemblies. End-jointed lumber manufactured with adhesives which meet the new requirements is being designated as “Heat Resistant Adhesive” or “HRA” on the grade stamp.
The ALSC Glued Lumber Policy requires that Heat Resistant Adhesives be qualified in accordance with one of two new ASTM standards, D7374-08 Practice for Evaluating Elevated Temperature Performance of Adhesives Used in End-Jointed Lumber and D7470-08 Practice for Evaluating Elevated Temperature Performance of End-Jointed Lumber Studs. Both standards require a wall assembly made with end-jointed lumber to be subjected to the ASTM E119 fire test. The tested-adhesive qualifies as a Heat Resistant Adhesive if the wall assembly achieves a one-hour fire-resistance-rating. End-jointed lumber manufactured with a Heat Resistant Adhesive under an auditing program of an ALSC-accredited grading agency is allowed to carry the HRA mark on the grade-stamp. End-jointed lumber manufactured with an adhesive not qualified as a Heat Resistant Adhesive will be designated as “Non-Heat Resistant Adhesive” or “non-HRA” on the grade stamp. Lumber carrying the HRA mark is permitted to be used interchangeably with solid-sawn members of the same species and grade in fire-resistance-rated applications.
For more information, please contact AWC at 202-463-4713 or [email protected].
See the following links for information:
1. FPL’s Wood Handbook
When converting lumber sizes the nominal dimensions (2x) or (4x) should NOT be converted, rather the actual sizes like 1.5″x3.5″ should be soft converted to 38x89mm.
2×4 = 38x89mm
2×6 = 38x140mm
2×8 = 38x184mm
2×10 = 38x235mm
2×12 = 38x286mm
Soft vs. Hard conversion – soft conversion is simply converting inch-pound units to the nearest equivalent metric unit. Panel products for example are typically 4’x8′ which would convert to 1220x2440mm. Hard conversion is when the metric units are rounded to a rational unit. In the preceding example hard conversion for panels would be 1200×2400.
To convert from board feet to cubic meters; according to ASTM E380, multiply board feet by 0.002359737.
See eCourse MAT 120 Metric and Wood for more information.
Currently, ASTM D7031 – Standard Guide for Evaluating Mechanical and Physical Properties of Wood-Plastic Composite Products states that the distinction between wood-plastic composites and “plastic lumber” is that a wood-plastic composite must contain less than 50 % plastic resin by weight (using an oven-dry basis for the wood fiber content).
The standard for determining design values for wood-plastic composites was developed by ASTM Committee D07 and is designated ASTM Test Method D7031-11 Standard Test Methods for Evaluating the Mechanical and Physical Properties of Wood-Plastic Composite Products.
There are several standards for determining design values for plastic lumber developed by ASTM Committee D20. Those standards should be consulted for information on plastic lumber.
AWC’s National Design Specification® (NDS®) for Wood Construction (2001 and later), outlines the following for pressure-preservative treated lumber (similar provisions are provided for structural glued laminated timber):
4.3.13 Pressure-Preservative Treatment
Reference design values apply to sawn lumber pressure treated by an approved process and preservative. Load factors greater than 1.6 shall not apply to structural members pressure-treated with water-borne preservatives.
For structural sawn lumber incised to increase penetration of preservatives, the NDS outlines the following:
4.3.8 Incising Factor, Ci
Reference design values shall be multiplied by the following incising factor, Ci, when dimension lumber is incised to parallel to grain a maximum depth of 0.4″, a maximum length of 3/8″, and a density of incisions up to 1100/ft2. Incising factors shall be determined by test or by calculation using reduced section properties for incising patterns exceeding these limits.

The wet service factor, CM, applies to dimension lumber (including those preservatively treated). According to NDS section 4.3.3:
Reference design values for structural sawn lumber are based on the moisture service conditions specified in 4.1.4. (19% or less for lumber). When the moisture content of the structural members in use differs from these moisture service conditions, reference design values shall be multiplied by the wet service factors, CM
(Similar provisions are provided for other structural wood products.)
To order a copy of the NDS, which is part of the Wood Design Package, call the AWC publications dept. at 1-800-890-7732 or visit the website.
Design values for Spruce-Pine-Fir (SPF) and SPF south (SPF-S) are included in NDS supplement.
SPF is a Canadian species combination graded per National Lumber Grades Authority (NLGA) grade rules. SPF south is the US species combination graded per the following agencies:
Northeastern Lumber Manufacturers Association (NELMA)
Northern Softwood Lumber Bureau (NSLB)
West Coast Lumber Inspection Bureau (WCLIB)
Western Wood Products Association (WWPA)
Similarly, Douglas fir – Larch (DF-L) is produced in the U.S. DF-L (North) or DF-L(N) is produced in Canada. They have different grade marks and different assigned design values. The same holds for Hem-Fir (HF) and HF(N). DF-L will typically be found in western states since it is produced there, while DF-L and DF-L(N) can be found in the Midwest. Note, however, that this is not always true, so the specifier and the contractor need to be in agreement about what is being specified and purchased.
Sometimes code officials are asked by landowners to approve rough-sawn (unsurfaced) lumber. This is a challenge since the code requires all lumber used in structures to be graded and stamped, something typically done at the mill after the lumber is surfaced. Since the surfacing (planing) of lumber can reveal defects that may affect the grade and which may go undetected in rough-sawn lumber, grading should be done by a qualified grading or inspection agency. The IRC and IBC permit a certificate of inspection from a qualified grading or inspection agency in lieu of grade stamps, but the certificate should contain clear information about the agency and the lumber being graded. Unique identifying marks should be applied to the lumber by the grading or inspection agency representative at the time of grading, or another positive identification method used. The marks or identifying method should be described in the certificate of inspection. The code official should not hesitate to require details of whatever identification method is used, and should inspect accordingly.
Floor joist span tables are tabulated based on allowable deflection limits of L/360. Floor live loads range from 30 psf for sleeping areas to 40 psf for other occupancies. Ceiling joist span tables are tabulated based on allowable deflection limits of L/240.
Typically a user will know the span and desired spacing for a given application. The user can select a species, size, and grade for trial use. Using the Design Values for Joists and Rafters, the user determines the modulus of elasticity and bending design value of the species, grade and size of lumber. Bending design values are already adjusted for load duration and repetitive member factors in the Design Values Supplement. With this information the user enters the span table with the given modulus of elasticity and determines the allowable span for an estimated size and spacing. If the allowable span is greater than that required for the application, the species, grade and size selected should then be verified for bending strength. At the bottom of each table, required bending design strengths for specific joist spacing are tabulated. If the bending design value selected from the Design Values Supplement is greater than the tabulated required bending design value, then the species and grade chosen is adequate. If the bending design value is less than the tabulated value then the user can either select a deeper member, decrease the joist spacing or select a higher lumber grade, thus a higher bending design value. For either option, modulus of elasticity has to be re-evaluated to ensure the deflection limits are maintained. Linear interpolation for intermediate design values is permitted.
More details available in the tutorial.
No. An engineer or architect should design cantilever members. Design of cantilever beams involves many variables including load, cantilever span and interior or back span. Often the load is not a single uniform distribution over the length of the member, and other additional loads are present, such as point loads at the end of the member. Because the system is composed of two pieces: the cantilever span, and the back span, the placement and magnitude of load on these sections singly or combined will cause different stresses to develop in the member. The designer seeks to find the worst combination of loading that will impose maximum shear, bending, or deflection in the member.
American Wood Council’s 2001 Wood Frame Construction Manual has engineered and prescriptive provisions that may give guidance for typical cantilever cases. For example, the Engineered Design provisions for sawn lumber floor joists in 2.3.1.6 state the maximum overhang length is limited to the depth of the joist if the end of the cantilever supports a load bearing wall or shear wall (Figure 1, below).

When designed for additional loads, cantilevers are limited to 4 times the depth of the joist (Figure 2, below).

The cantilevered joist must be located directly over studs unless the top plates are designed to carry the loads. If the end of the cantilever supports a non-loadbearing non-shear wall, then the maximum overhang length is limited to one-fourth of the joist span (Figure 3, below).

Consult manufacturer’s recommendations if using I-joists. Prescriptive Design provisions found in 3.3.1.6.1 for sawn lumber floor joists are the same except that for roof live loads and ground snow loads less than or equal to 20 psf and 30 psf, respectively, cantilevers shall not exceed one-eighth of the joist span for lumber joists supporting only a roof with a clear span of 28 feet or less.
A variety of Span Table Documents and Span Calculator products are available for use in wood building design, complete with a tutorial for their use.
The online AWC Span Calculator performs calculations for ALL species and grades of commercially available softwood and hardwood lumber as found in the NDS Supplement. There are also several other online span tables available for various regional species and grades of lumber and loading conditions:
Canadian Span Tables and Calculator
Southern Pine Span Tables
Western Span Tables and Calculator
Rafter span tables are tabulated based on allowable deflection limits of either L/240 or L/180.
The L/240 limitation allows for attachment of a ceiling to the underside of the rafter by limiting possible cracking. Cathedral ceilings are an example of this type of application. The L/180 deflection limitation would apply to a rafter with no ceiling directly attached, so deflection is not a concern.
Roof live and snow loads range from 30 psf to 60 psf. Roof dead loads range from 10 to 20 psf.
Typically a user will know the span and desired spacing for a given application. The user can select a species, size, and grade for trial use. Using the Design Values for Joists and Rafters, the user determines the modulus of elasticity and bending design value of the species, grade and size of lumber. Bending design values are already adjusted for load duration and repetitive member factors in the Design Values Supplement. With this information, the user enters the span table with the given bending design value and determines the allowable span for an estimated size and spacing. If the allowable span is greater than that required for the application, the species, grade and size selected should then be verified for stiffness or deflection. At the bottom of each table required modulus of elasticity for specific joist spacing are tabulated. If the modulus of elasticity is less than the tabulated value then the user can either select a deeper member, decrease the joist spacing or select a high lumber grade, thus a higher modulus of elasticity. For either option, bending design strength has to be re-evaluated to ensure that strength limits are maintained.
Decking Span Tables
Redwood – Click “Deck Construction” to see their updated version
http://www.calredwood.org/literaturelibrary/
Southern Pine
http://www.southernpine.com/span-tables/
Western Red Cedar
http://www.realcedar.com/decking/products/
National Lumber Grades Authority’s rule #126 under all species that have been graded according to NLGA (which includes Ponderosa Pine) for Exterior Patio Decking provides grade rules as follows:
“Exterior patio decking rough or unsurfaced – kiln dried, air dried, or unseasoned 5/4″ to 2″ thicknesses, 4″ and wider for flatwise load applications where spans are not to exceed 16″ on centre.”
The American Wood Preservers Association (AWPA) establishes standards for preservative retention levels for wood used in construction
- McGraw-Hill publishes a Wood Engineering and Construction Handbook, which includes a chapter on Adhesives (Chapter 12). It is authored by Richard Avent, Ph.D., P.E. Contact information:Department of Civil and Environmental Engineering
Louisiana State University
3505B CEBA
Baton Rouge, LA 70803
USAPhone: (225) 578-8735
Fax: (225) 578-8652
Email: [email protected]
Website: Department of Civil and Environmental Engineering (CEE) - ASCE publishes a document called Evaluation, Maintenance and Upgrading of Wood Structures, 1982, which includes a chapter (Chapter 5) on methods of repair and case studies where epoxies were used to repair wood structural members.American Society of Civil Engineers
1801 Alexander Bell Drive
Reston, VA 20191Phone: (800) 548-2723
Website: http://www.asce.org - The American Institute of Timber Construction (AITC) publishes a document entitled Use of Epoxies in Repair of Structural Glued Laminated Timber (1990). It is available to download free from their website at https://www.aitc-glulam.org.
The Treated Wood Council has developed a fact sheet on CCA-preserved wood.
The requirement for panels or let-in bracing in the corners of conventionally-constructed walls is, in general a non-engineered detail that provides lateral resistance of the wall assembly and structure when subjected to lateral loads such as occur during wind or seismic events. Overturning restraint, in this case is provided by the dead load acting on the wall and/or anchorage provided by perpendicular walls. However, when openings occur near the corners, the aspect ratio (height/length) of the wall located at the corner will vary with the type of construction (braced wall panel vs. shear wall) used as well as the size of the opening.
Basic Requirements
Section R602.10.4 of the International Residential Code (IRC) provides basic wall bracing requirements and specifies the minimum length of braced wall panels for different types of exterior sheathing – in general this is 4 feet. Therefore, where an opening exists near a corner, the minimum length of braced wall panel required (at the corner and elsewhere) is 4 feet for an 8 foot high wall.
Using Continuous Structural Panel Sheathing
Using wood structural panel sheathing (OSB or Plywood) on all sheathable areas of all exterior walls and interior braced wall lines as well as having corners constructed in accordance with IRC Figure R602.10.5, can reduce the minimum length of braced panel required as per Table R602.10.5 (e.g. can reduce the min. 4 foot length to a 2 foot length of braced wall panel for an 8 foot high wall, or to a 2-1/2 foot length for a 10 foot high wall – provided the maximum opening height next to this braced wall panel is 65% of the wall height.
R602.10.6 provides further options where one can essentially use 2 foot 8 inch panels (min.) for walls up to 10 feet in height with no restriction on max. opening height – but this requires the use of tie-down devices, and other additional fastening and sheathing requirements.
Note that recent code change proposals for the upcoming 2006 IRC are looking to permit walls with 6:1 aspect ratios used with continuous structural panel sheathing.
AWC’s WCD #3. Design of Wood Formwork for Concrete Structures (T13). 1987 NO LONGER IN PRINT. For archival information, contact AWC.
APA-The Engineered Wood Association publishes Concrete Forming available for free on their website.
The American Concrete Institute (ACI) published the Guide to Formwork for Concrete available on their website.
Concrete Form Plywood
Concrete form plywood panels are manufactured in conformance with the requirements of the U.S. Department of Commerce Voluntary Product Standard PS 1, Structural Plywood. PS 1 establishes minimum requirements for the principle types and grades of construction and industrial plywood including wood species, veneer grading, glue bond, panel construction and workmanship, dimensions and tolerances, marking, moisture content, quality control and certification.
Concrete form meets the requirements for an “Exterior” bond classification and is manufactured with “B” face and back veneers and “C” or better inner plies. Bond classification is related to the moisture resistance of the glue bond under intended end-use conditions and does not relate to the physical (erosion, ultraviolet, etc.) or biological (mold, fungal decay, insect, etc.) resistance of the panel.
Class 1 concrete form plywood is designed to provide superior performance in the most demanding applications. A Class 1 panel, as defined in PS 1, is a panel with a Group 1 species in the face veneers, Group 1 or Group 2 species in the crossbands and Group 1, 2, 3, or 4 species in the center plies. A Group number is used to classify species covered by PS 1. Numbers range from 1 to 5. Strength and stiffness properties of species in Group 1 are typically highest, while the strength and stiffness properties of species in Group 5 are the lowest.
Structural I plywood used for formwork is manufactured with Group 1 species in all plies. It is specifically designed for applications where higher strength properties are required.
PS 1 is written in such a way that Class I or Class II concrete form plywood can only be so-designated if produced by manufacturers located in North America. Since many non-North American manufacturers produce concrete form panels, another grade marking approach is used in these situations. Such products cannot be identified as either Class I or Class II, but – under PS 1 – these products can be tested (by an accredited laboratory in accordance with approved acceptance criteria) to determine a Group Classification, which is then shown on the grade stamp. As a result, there is a designation: BB O & ES [BB grade, (release) oiled, and edge-sealed] for concrete form plywood manufactured outside of North America.
It is generally true that test reports must come from laboratories accredited (for the specific test method under consideration) by organizations such as the International Accreditation Service, Inc. (IAS), or by another accreditation body that is a signatory to the Mutual Recognition Arrangement (MRA) of the International Laboratory Accreditation Cooperation (ILAC). As regards evaluation reports requiring periodic inspections of the manufacturing facility by a third-party agency, the inspection agency must be accredited by IAS or by an accreditation body that is a partner of IAS in an MRA.
Yes. From section 9.1.3 of the NDS: The term “wood structural panel” refers to a wood-based panel product bonded with a waterproof adhesive. Included under this designation are plywood, OSB, and composite panels. The term “composite panel” refers to a wood structural panel comprised of wood veneer and reconstituted wood-based material and bonded with waterproof adhesive. The term OSB refers to a mat-formed wood structural panel comprised of thin rectangular wood stands arranged in cross-aligned layers with surface layers normally arranged in the long panel direction and bonded with waterproof adhesive. The term “plywood’ refers to a wood structural panel comprised of plies of wood veneer arranged in cross-aligned layers. The plies are bonded with an adhesive that cures on application of heat and pressure.
For additional information, contact the following organizations:
APA – THE ENGINEERED WOOD ASSOCIATION
7011 S. 19th Street
Tacoma, Washington 98466
253-565-6600
Fax: 253-565-7265
Website: http://www.apawood.org/
PFS-TECO
1507 Matt Pass
Cottage Grove, WI 53527
Phone: 608-839-1013
Website: https://www.pfsteco.com/
APA publishes information on how to deal with overdriven fasteners. www.apawood.org
The Midwest Plan Service publishes a Structures and Environment Handbook which address gussets in section 406.5 under Wood Truss Design. The most recent edition is a 1987 Revised 11th Edition.
Midwest Plan Service
122 Davidson Hall
Iowa State University
Ames, IA 50011-3080
Toll Free: (800) 562-3618
Customer Service: (515) 294-4337
Fax: (515) 294-9589
E-mail: [email protected]
Other info available at https://www-mwps.sws.iastate.edu/
The USDA Forest Products Lab has a publication called the Wood Handbook that contains information regarding finishes for wood products. View this information online at:
http://www.fpl.fs.fed.us/documnts/fplgtr/fplgtr113/fplgtr113.htm
Chapters 14 and 15 may provide information specific to your needs. The TOC for both chapters is as follows:
Chapter 14 Wood Preservation (PDF 1.2 MB)
Wood Preservatives
Preservative Effectiveness
Effect of Species on Penetration
Preparation of Timber for Treatment
Application of Preservatives
Handling and Seasoning of Timber After Treatment
Quality Assurance for Treated Wood
Chapter 15 Finishing of Wood (PDF 2.2 MB)
Factors Affecting Finish Performance
Control of Water or Moisture in Wood
Types of Exterior Wood Finishes
Application of Wood Finishes
Finish Failure or Discoloration
Finishing of Interior Wood
Finishes for Items Used for Food
Wood Cleaners and Brighteners
Paint Strippers
Lead-Based Paint
The Forest Products Society also publishes a document called:
Building An Industrial Wood Finish
The information contained in this manual has been gleaned from the experiences of the author collected during more than 30 years as a supplier of wood finishes to manufacturers of finished wood products and as a consultant to the industry. The purpose of the manual is to help manufacturers gain a full understanding of all of the factors that impact the quality, durability, cost, and environmental impact of finished wood products. Four chapters cover: Finishing Products – multiple-step wood furniture finishes, kitchen cabinet and office furniture finishes, specialty wood finishes, and waterborne/water-based finishes; Executing the Wood Finish – wood finish application hardware options, examples of wood finishing manufacturing lines, and transfer efficiency and calculation of wood finish costs; Wood Finishes and the Environment – legal and regulatory issues and pollution prevention opportunities through hardware and finish product improvements; and Quality Control – white room wood preparation, wood finish variables and recommendations, finish inconsistencies/troubleshooting, the importance of lighting, and analyzing rejected pieces.
Publication #7247 (1 lb)
Available through their website:
http://www.forestprod.org/
The USDA Forest Service Wood Handbook pages 17-2 through 17-5 contain material on wood mold and mildew.
Publication link: Forest Service Wood Handbook.
The Build Green: Wood Can Last for Centuries report explains why wood decays, alerts the homeowner to conditions that can result in decay in buildings, and describes measures to prevent moisture-related damage to wood.
Publication link: Build Green: Wood Can Last for Centuries.
Mold and Moisture in Homes
Mold. It’s all around us. We use mold to make cheese, process wine, and produce helpful drugs such as penicillin. We also see unwanted mold in places such as damp basements. Mold even exists on human bodies. So, one might ask, what’s causing the current questioning about mold? There’s no easy answer to that question. However, there are some reasonably straightforward facts about how and when mold might start to grow in or around your home.
Facts
FACT: Spores, the dormant form of mold, are in the air we breathe, the soil in our gardens, and in and around virtually every part of our homes.
FACT: Mold spores will not actively colonize, or grow, without adequate supplies of food, air, and moisture. In typical homes, the normal control of moisture levels prevents colonization of mold spores.
FACT: A properly constructed building envelope is designed to keep the inside of your home dry (including the interior and concealed building spaces) to stop mold spores from becoming active. This building envelope also insures that wood products quickly achieve and remain at a moisture level that will not support mold growth.
FACT: Except for cases in which moisture is artificially introduced into the structure (for example, by interior water leakage, unusually high interior humidity levels, or penetration of the building envelope), mold will generally not become active in your home.
FACT: All mold spores can not be permanently eradicated by cleaning or disinfecting. While cleaning can remove spores present at the time, it will generally not protect surfaces against mold spores that arrive after cleaning.
FACT: Conditions that are sufficiently moist to support active mold colonization are also sufficiently moist to degrade the materials in your home. For example, wood products may start to decay, metal products may begin to rust, and other products may begin to deteriorate.
Techniques to minimize mold problems in your home
Control build-up of moisture within your home. Install and use ventilating fans in kitchens and bathrooms. Be sure that fan exhausts are ducted to the outside. Use dehumidifiers where necessary, but don’t allow the dehumidifier to become a source of mold itself. Insulate any ducts which pass through unheated attic or crawl spaces.
If mold or mildew begin to grow in or on any part of your home, find the source of moisture intrusion and stop it. If moisture intrusion has been occurring over time, hire a professional to examine the structure to determine if any permanent damage has occurred.
Naturally durable species are those that are naturally resistant to insect damage and moisture or decay.
Some of those species include cedar, black locust, and redwood. Also consider using pressure treated wood for such applications where durability is an issue.
Check out the USDA Forest Product Lab’s Wood Handbook for more information.
For information concerning metal plate connected wood trusses:
Truss Plate Institute
Structural Building Components Association
For information on bracing of wood trusses: Structural Building Components Association.
Breakaway walls or flood vents are not a choice. Vents can be placed in breakaway walls, but solid walls with vents cannot be used in place of breakaway walls. FEMA Technical Bulletin #9 outlines guidelines for breakaway walls.
Field applied treatments are available to treat cut ends. The American Wood Protection Association (AWPA) states:
“…Drilled holes and cut ends need to be treated with a preservative, such as copper naphthenate or oxine copper (mostly for exterior use) or a boron-based preservative (for interior uses only). Copper naphthenate specified in AWPA Standard M4 for field treatment contains 2% copper and is sometimes available in paint, hardware, or building supply stores…”
Sometimes code officials are asked by landowners to approve rough-sawn (unsurfaced) lumber. This is a challenge since the code requires all lumber used in structures to be graded and stamped, something typically done at the mill after the lumber is surfaced. Since the surfacing (planing) of lumber can reveal defects that may affect the grade and which may go undetected in rough-sawn lumber, grading should be done by a qualified grading or inspection agency. The IRC and IBC permit a certificate of inspection from a qualified grading or inspection agency in lieu of grade stamps, but the certificate should contain clear information about the agency and the lumber being graded. Unique identifying marks should be applied to the lumber by the grading or inspection agency representative at the time of grading, or another positive identification method used. The marks or identifying method should be described in the certificate of inspection. The code official should not hesitate to require details of whatever identification method is used, and should inspect accordingly.
AWC has links to historic documents on our website here: NDS Archives
Designers can view and download copies of the 1922 Design Values for Structural Timber and the 1944 NDS on this page. Archive versions of the NDS are also available for a small fee.
Ecourses are also available relating to evaluating in-service structures. Both DES140 – Structural Condition Assessment of In-Service Wood and DES160 – Evaluation of Recommended Allowable Design Properties for Wood in Existing Structures can provide helpful information to professionals working with existing structures.
See also General FAQ, “Where can I find information on evaluation, maintenance, and repair of existing structures?”
Beam load tables in WSDD are tabulated based on spans from 4 to 32 feet and for lumber sizes from 2×4 to 24×24 inches.
Typically a user will know the span and load for a given application. The user can select a species, size, and grade for trial use. Using the Design Values for Wood Construction Supplement, the user determines the modulus of elasticity, bending design value, and shear parallel to grain design value of the species, grade and size of lumber. These design values need to be modified for all applicable adjustment factors including load duration and repetitive member factors from the Design Values Supplement and NDS. With this information the user enters the load table with the given bending design value and determines the allowable load for an estimated size. If the allowable load is greater than that required for the application, the species, grade and size selected should then be verified for stiffness and shear. Below each tabulated load value are the required modulus of elasticity and shear design value for the specific application. If the modulus of elasticity and shear design value selected from the Design Values Supplement is greater than the tabulated required modulus of elasticity and shear value, then the species and grade chosen is adequate. If the modulus of elasticity or shear design value is less than the tabulated value then the user can either select a larger member, or select a higher lumber grade. For either option, bending design strength has to be re-evaluated to ensure that strength limits are maintained. For multiple members or built-up members, the allowable load would be determined by dividing the actual load by the number of plies selected for that particular member. Linear interpolation for intermediate design values is permitted.
Wood Structural Design Data (WSDD) tabulates two different types of column load tables: simple solid columns and spaced columns.
Typically, a user will enter the tables with a known length for the column and a given load. The user can select a species, size, and grade for trial use. Using the Design Values for Wood Construction Supplement, the user determines the modulus of elasticity and compression parallel to grain design value of the species, grade and size of lumber. These design values need to be modified for all applicable adjustment factors including load duration from the Design Values Supplement and NDS. The user should determine the length to depth ratio based on the size of member selected. With this information the user enters the load table with the given modulus of elasticity and compression design value and determines the allowable load for the calculated length to depth ratio. If the allowable load is greater than that required for the application, the species, grade and size selected are adequate. If the allowable load is less than required then the user can either select a larger member, or select a higher lumber grade.
There are no specific provisions for connections for built-up beams. WCD#1, Details for Conventional Wood Frame Construction outlines the following general criteria:
Beams and girders are of solid timber or built-up construction in which multiple pieces of nominal 2-inch thick lumber are nailed together with the wide faces vertical. Such pieces are nailed with two rows of 20d nails-one row near the top edge and the other near the bottom edge. Nails in each row are spaced 32 inches apart. End joints of the nailed lumber should occur over the supporting column or pier. End joints in adjacent pieces should be at least 16 inches apart, Figure 15.
There is a General FAQ dealing with increased buckling capacity for built-up beams:
“Is there a design method for increased buckling capacity of built-up wood beams?”
AWC’s Special Design Provisions for Wind and Seismic, Table 4.2D contains shear capacities for lumber sheathing attached straight and diagonally. Table 4.3D contains shear wall capacities for straight and diagonal lumber sheathing as well.
AWC also publishes Plank and Beam Framing for Residential Buildings (WCD-4) (T14). It shows how this floor and roof framing system, traditionally used in heavy timber structures, can be adapted to home building.
The International Building Code contains design capacities for diagonally sheathed lumber diaphragms in section 2306.3 Wood Diaphragms. Visit http://www.iccsafe.org for ordering information.
Analysis Methods for Horizontal Wood Diaphragms by Jephcott and Dewdney from proceedings of a Workshop on Design of Horizontal Wood Diaphragms (ATC-7-1) conducted by Applied Technology Council on November 19-20, 1980 (25 pages). Visit their website at http://www.atcouncil.org/ to order.
The “vented airspace” refers to spaces which have the ability to move air from the space that will be vented to the outside. This is a common practice in attics where the building codes require that the space be “vented” and they specify the amount of air movement by a percentage of the ceiling area (1/150 or 1/300 depending on the vapor barrier).
For more information, see WCD #6 – Design of Wood Frame Structures for Permanence. Download free here.
WCD #2 Tongue and Groove Roof Decking
Timber tongue and groove decking is a specialty lumber product, constituting an important part of modern timber construction, that can be used for many applications to provide an all-wood appearance. Nominal three and four inch decking is especially well adapted for use with glued laminated arches and girders and is easily and quickly erected. This document contains all that’s needed to design and construct tongue and groove wood roof decking.
AWC’s Wood Construction Data #4, Plank and Beam Framing for Residential Buildings (WCD-4). Shows how this floor and roof framing system, traditionally used in heavy timber structures, can be adapted to home building. 28 pages. (T14)
TR4 contains information on designing a Low-Profile Wood Floor System, test results, discussion and conclusions, and construction recommendations. * NO LONGER IN PRINT. (TR4) Published 1964. For archival information, contact AWC.
AWC’s The Wood-Frame House as a Structural Unit (TR-5) – Evaluates structural performance of a full-scale house subjected to simulated wind and gravity load combinations. (TR5) Download free.
Chapter 16 of the National Design Specification (NDS) for Wood Construction provides a code-recognized approach for determining the fire resistance of solid sawn, glulam, and select structural composite lumber (SCL) materials, including laminated veneer lumber (LVL), parallel strand lumber (PSL), laminated strand lumber (LSL), and cross-laminated timber (CLT). Design for Code Acceptance Document 2, titled “Design of Fire-Resistive Exposed Wood Members” (DCA 2) provides resources for users to calculate fire resistance for exposed wood members, in compliance with Chapter 16 of the NDS including flexural members (beams), compression members (columns), and solid lumber including decking and other structural members. Additional information including background, examples, and tables providing allowable load ratios for different member types and sizes can be found in Technical Report 10 (TR10).
See also:
In a double-shear connection, the main member is the member in the middle. The side members would be the outermost members.
Yes, the equations are structured that they will allow capacities to be calculated for any material being connected to wood, so long as the bearing design properties for the material are known. See 2015 NDS Chapter 11.2.3 and 11.2.4 and Technical Report 12.
Beam load tables in WSDD are tabulated based on spans from 4 to 32 feet and for lumber sizes from 2×4 to 24×24 inches.
Typically a user will know the span and load for a given application. The user can select a species, size, and grade for trial use. Using the Design Values for Wood Construction Supplement, the user determines the modulus of elasticity, bending design value, and shear parallel to grain design value of the species, grade and size of lumber. These design values need to be modified for all applicable adjustment factors including load duration and repetitive member factors from the Design Values Supplement and NDS. With this information the user enters the load table with the given bending design value and determines the allowable load for an estimated size. If the allowable load is greater than that required for the application, the species, grade and size selected should then be verified for stiffness and shear. Below each tabulated load value are the required modulus of elasticity and shear design value for the specific application. If the modulus of elasticity and shear design value selected from the Design Values Supplement is greater than the tabulated required modulus of elasticity and shear value, then the species and grade chosen is adequate. If the modulus of elasticity or shear design value is less than the tabulated value then the user can either select a larger member, or select a higher lumber grade. For either option, bending design strength has to be re-evaluated to ensure that strength limits are maintained. For multiple members or built-up members, the allowable load would be determined by dividing the actual load by the number of plies selected for that particular member. Linear interpolation for intermediate design values is permitted.
Wood Structural Design Data (WSDD) tabulates two different types of column load tables: simple solid columns and spaced columns.
Typically, a user will enter the tables with a known length for the column and a given load. The user can select a species, size, and grade for trial use. Using the Design Values for Wood Construction Supplement, the user determines the modulus of elasticity and compression parallel to grain design value of the species, grade and size of lumber. These design values need to be modified for all applicable adjustment factors including load duration from the Design Values Supplement and NDS. The user should determine the length to depth ratio based on the size of member selected. With this information the user enters the load table with the given modulus of elasticity and compression design value and determines the allowable load for the calculated length to depth ratio. If the allowable load is greater than that required for the application, the species, grade and size selected are adequate. If the allowable load is less than required then the user can either select a larger member, or select a higher lumber grade.
There are no specific provisions for connections for built-up beams. WCD#1, Details for Conventional Wood Frame Construction outlines the following general criteria:
Beams and girders are of solid timber or built-up construction in which multiple pieces of nominal 2-inch thick lumber are nailed together with the wide faces vertical. Such pieces are nailed with two rows of 20d nails-one row near the top edge and the other near the bottom edge. Nails in each row are spaced 32 inches apart. End joints of the nailed lumber should occur over the supporting column or pier. End joints in adjacent pieces should be at least 16 inches apart, Figure 15.
There is a General FAQ dealing with increased buckling capacity for built-up beams:
“Is there a design method for increased buckling capacity of built-up wood beams?”
AWC’s Special Design Provisions for Wind and Seismic, Table 4.2D contains shear capacities for lumber sheathing attached straight and diagonally. Table 4.3D contains shear wall capacities for straight and diagonal lumber sheathing as well.
AWC also publishes Plank and Beam Framing for Residential Buildings (WCD-4) (T14). It shows how this floor and roof framing system, traditionally used in heavy timber structures, can be adapted to home building.
The International Building Code contains design capacities for diagonally sheathed lumber diaphragms in section 2306.3 Wood Diaphragms. Visit http://www.iccsafe.org for ordering information.
Analysis Methods for Horizontal Wood Diaphragms by Jephcott and Dewdney from proceedings of a Workshop on Design of Horizontal Wood Diaphragms (ATC-7-1) conducted by Applied Technology Council on November 19-20, 1980 (25 pages). Visit their website at http://www.atcouncil.org/ to order.
WCD #6 – Design of Wood Frame Structures for Permanence
The Southern Pine Council has information on termites and preservation against them at their website: http://www.southernpine.com/.
Termite Control: Results of Testing at the U.S. Forest Service is available from the USDA FS at http://www.srs.fs.usda.gov/pubs/viewpub.php?index=1482.
The “vented airspace” refers to spaces which have the ability to move air from the space that will be vented to the outside. This is a common practice in attics where the building codes require that the space be “vented” and they specify the amount of air movement by a percentage of the ceiling area (1/150 or 1/300 depending on the vapor barrier).
For more information, see WCD #6 – Design of Wood Frame Structures for Permanence. Download free here.
AWC’s Wood Construction Data #1 Details for Conventional Wood Frame Construction, which provides proper methods of construction in wood frame buildings, with information on features which contribute to the satisfactory performance of wood structures.
AWC publishes the Wood Frame Construction Manual for One- and Two-Family Dwellings to provide solutions based on engineering analysis, in accordance with recognized national codes and standards. Like conventional construction, the engineered solutions are provided in a prescriptive format.
WCD #2 Tongue and Groove Roof Decking
Timber tongue and groove decking is a specialty lumber product, constituting an important part of modern timber construction, that can be used for many applications to provide an all-wood appearance. Nominal three and four inch decking is especially well adapted for use with glued laminated arches and girders and is easily and quickly erected. This document contains all that’s needed to design and construct tongue and groove wood roof decking.
AWC’s Wood Construction Data #4, Plank and Beam Framing for Residential Buildings (WCD-4). Shows how this floor and roof framing system, traditionally used in heavy timber structures, can be adapted to home building. 28 pages. (T14)
AWC’s WCD #6, Design of Wood Frame Structures for Permanence. Text and detail drawings provide latest information on protection against moisture, termites, and decay. Emphasizes importance of proper design and construction to achieve permanent wood structures. 16 pages. (T16) Free download here.
AWC’s TR3. Details of test of unprotected laminated wood and rolled steel beams when simultaneously exposed to identical fire conditions. 8 pages. NO LONGER IN PRINT. (T23) Published 1979. For archival information, contact AWC.
AWC’s The Wood-Frame House as a Structural Unit (TR-5) – Evaluates structural performance of a full-scale house subjected to simulated wind and gravity load combinations. (TR5) Download free.
AWC’s a Performance Comparison of a Wood-Frame and a Masonry Structure (TR-8) – A study of the comparative costs and comfort in heating and cooling a wood-frame and a masonry test structure in the Phoenix, Arizona area. (T26) Download free here.
AWC’s Heat Release Rates of Construction Assemblies by the Substitution Method (TR-9) – Study describing efforts to develop measurement methods for determining the rate of heat release of full-scale assemblies. (T27) Download free here.
Chapter 16 of the National Design Specification (NDS) for Wood Construction provides a code-recognized approach for determining the fire resistance of solid sawn, glulam, and select structural composite lumber (SCL) materials, including laminated veneer lumber (LVL), parallel strand lumber (PSL), laminated strand lumber (LSL), and cross-laminated timber (CLT). Design for Code Acceptance Document 2, titled “Design of Fire-Resistive Exposed Wood Members” (DCA 2) provides resources for users to calculate fire resistance for exposed wood members, in compliance with Chapter 16 of the NDS including flexural members (beams), compression members (columns), and solid lumber including decking and other structural members. Additional information including background, examples, and tables providing allowable load ratios for different member types and sizes can be found in Technical Report 10 (TR10).
See also:
Yes, the assumption is that the connector will develop a hinge in the body of either the main member or side member(s), not in the gap.
For tapered tip fasteners, the main member is the one that contains the point of the fastener. For bolted connections, the distinction is less clear. In general, it is assumed the member which applies the load is the side member, but it actually doesn’t matter as long as the correct properties are used for the main and side members respectively.
In a double-shear connection, the main member is the member in the middle. The side members would be the outermost members.
Yes, the equations are structured that they will allow capacities to be calculated for any material being connected to wood, so long as the bearing design properties for the material are known. See 2015 NDS Chapter 11.2.3 and 11.2.4 and Technical Report 12.
The 2015 National Design Specification for Wood Construction (NDS) Chapter 16 and Technical Report 10 allows for the design of wood members exposed to fire.
http://www.fpl.fs.fed.us/documnts/fplgtr/fplgtr190/chapter_04.pdfThe Canadian Wood Council has a technical bulletin on the thermal performance of light-frame wood assemblies. It discusses an R value of 1.5/inch of thickness for wood products:
http://www.cwc.ca
Also, from 1993 ASHRAE standard, the R value per inch of thickness is about 1.1 F*ft^2*h/BTU per inch of thickness.
Thermal conductivity is a measure of the rate of heat flow through one unit thickness of a material subjected to a temperature gradient. The thermal conductivity of common structural woods is much less than the conductivity of metals with which wood often is mated in construction. It is about two to four times that of common insulating material. For example, the conductivity of structural softwood lumber at 12% moisture content is in the range of 0.7 to 1.0 Btu×in/(h×ft2×oF) compared with 1,500 for aluminum, 310 for steel, 6 for concrete, 7 for glass, 5 for plaster, and 0.25 for mineral wool.
In Chapter 4 of the USDA Forest Products Lab Wood Handbook, Table 4-7, entitled “Thermal conductivity of selected hardwoods and softwoods” lists thermal properties for various species of wood.
Thermal expansion/contraction for wood is minimal. The USDA Forest Products Lab Wood Handbook, Chapter 3. Page 3-21 outlines thermal expansion coefficients for wood, which are almost microscopic. Any expansion joint would be based on roofing material requirements.
AWC’s TR3. Details of test of unprotected laminated wood and rolled steel beams when simultaneously exposed to identical fire conditions. 8 pages. NO LONGER IN PRINT. (T23) Published 1979. For archival information, contact AWC.
AWC’s Wood Construction Data #1 Details for Conventional Wood Frame Construction, which provides proper methods of construction in wood frame buildings, with information on features which contribute to the satisfactory performance of wood structures.
AWC publishes the Wood Frame Construction Manual for One- and Two-Family Dwellings to provide solutions based on engineering analysis, in accordance with recognized national codes and standards. Like conventional construction, the engineered solutions are provided in a prescriptive format.